Generative AI Lab 7.8: HIPAA-Compliant Audit Logging
Generative AI Lab 7.8 brings HIPAA-compliant audit logging to the platform alongside a series of usability improvements across NER, Visual NER, and PDF annotation workflows.
The headline feature is the new Audit Logs Dashboard, which gives administrators centralized, real-time visibility into user activity, data exports, project lifecycle events, and API behavior, directly supporting compliance, security, and operational transparency requirements.
Beyond auditing, this release delivers improvements to Visual NER document navigation, more reliable pre-annotation deployment feedback, clearer test outcome reporting in the Playground, smarter comment navigation during review, and responsive analytics charts for smaller screens. A broad set of bug fixes addresses issues across imports, annotation, integrations, and system stability.
Audit Logs Dashboard: System-Wide Activity Tracking for Regulated Environments
What’s New
Generative AI Lab 7.8 introduces the Audit Logs Dashboard, a HIPAA-compliant auditing solution that gives administrators real-time, granular visibility into all platform activity. Every user action, data access event, export, and API call is logged with timestamps and user attribution, providing the traceability that regulated environments demand.
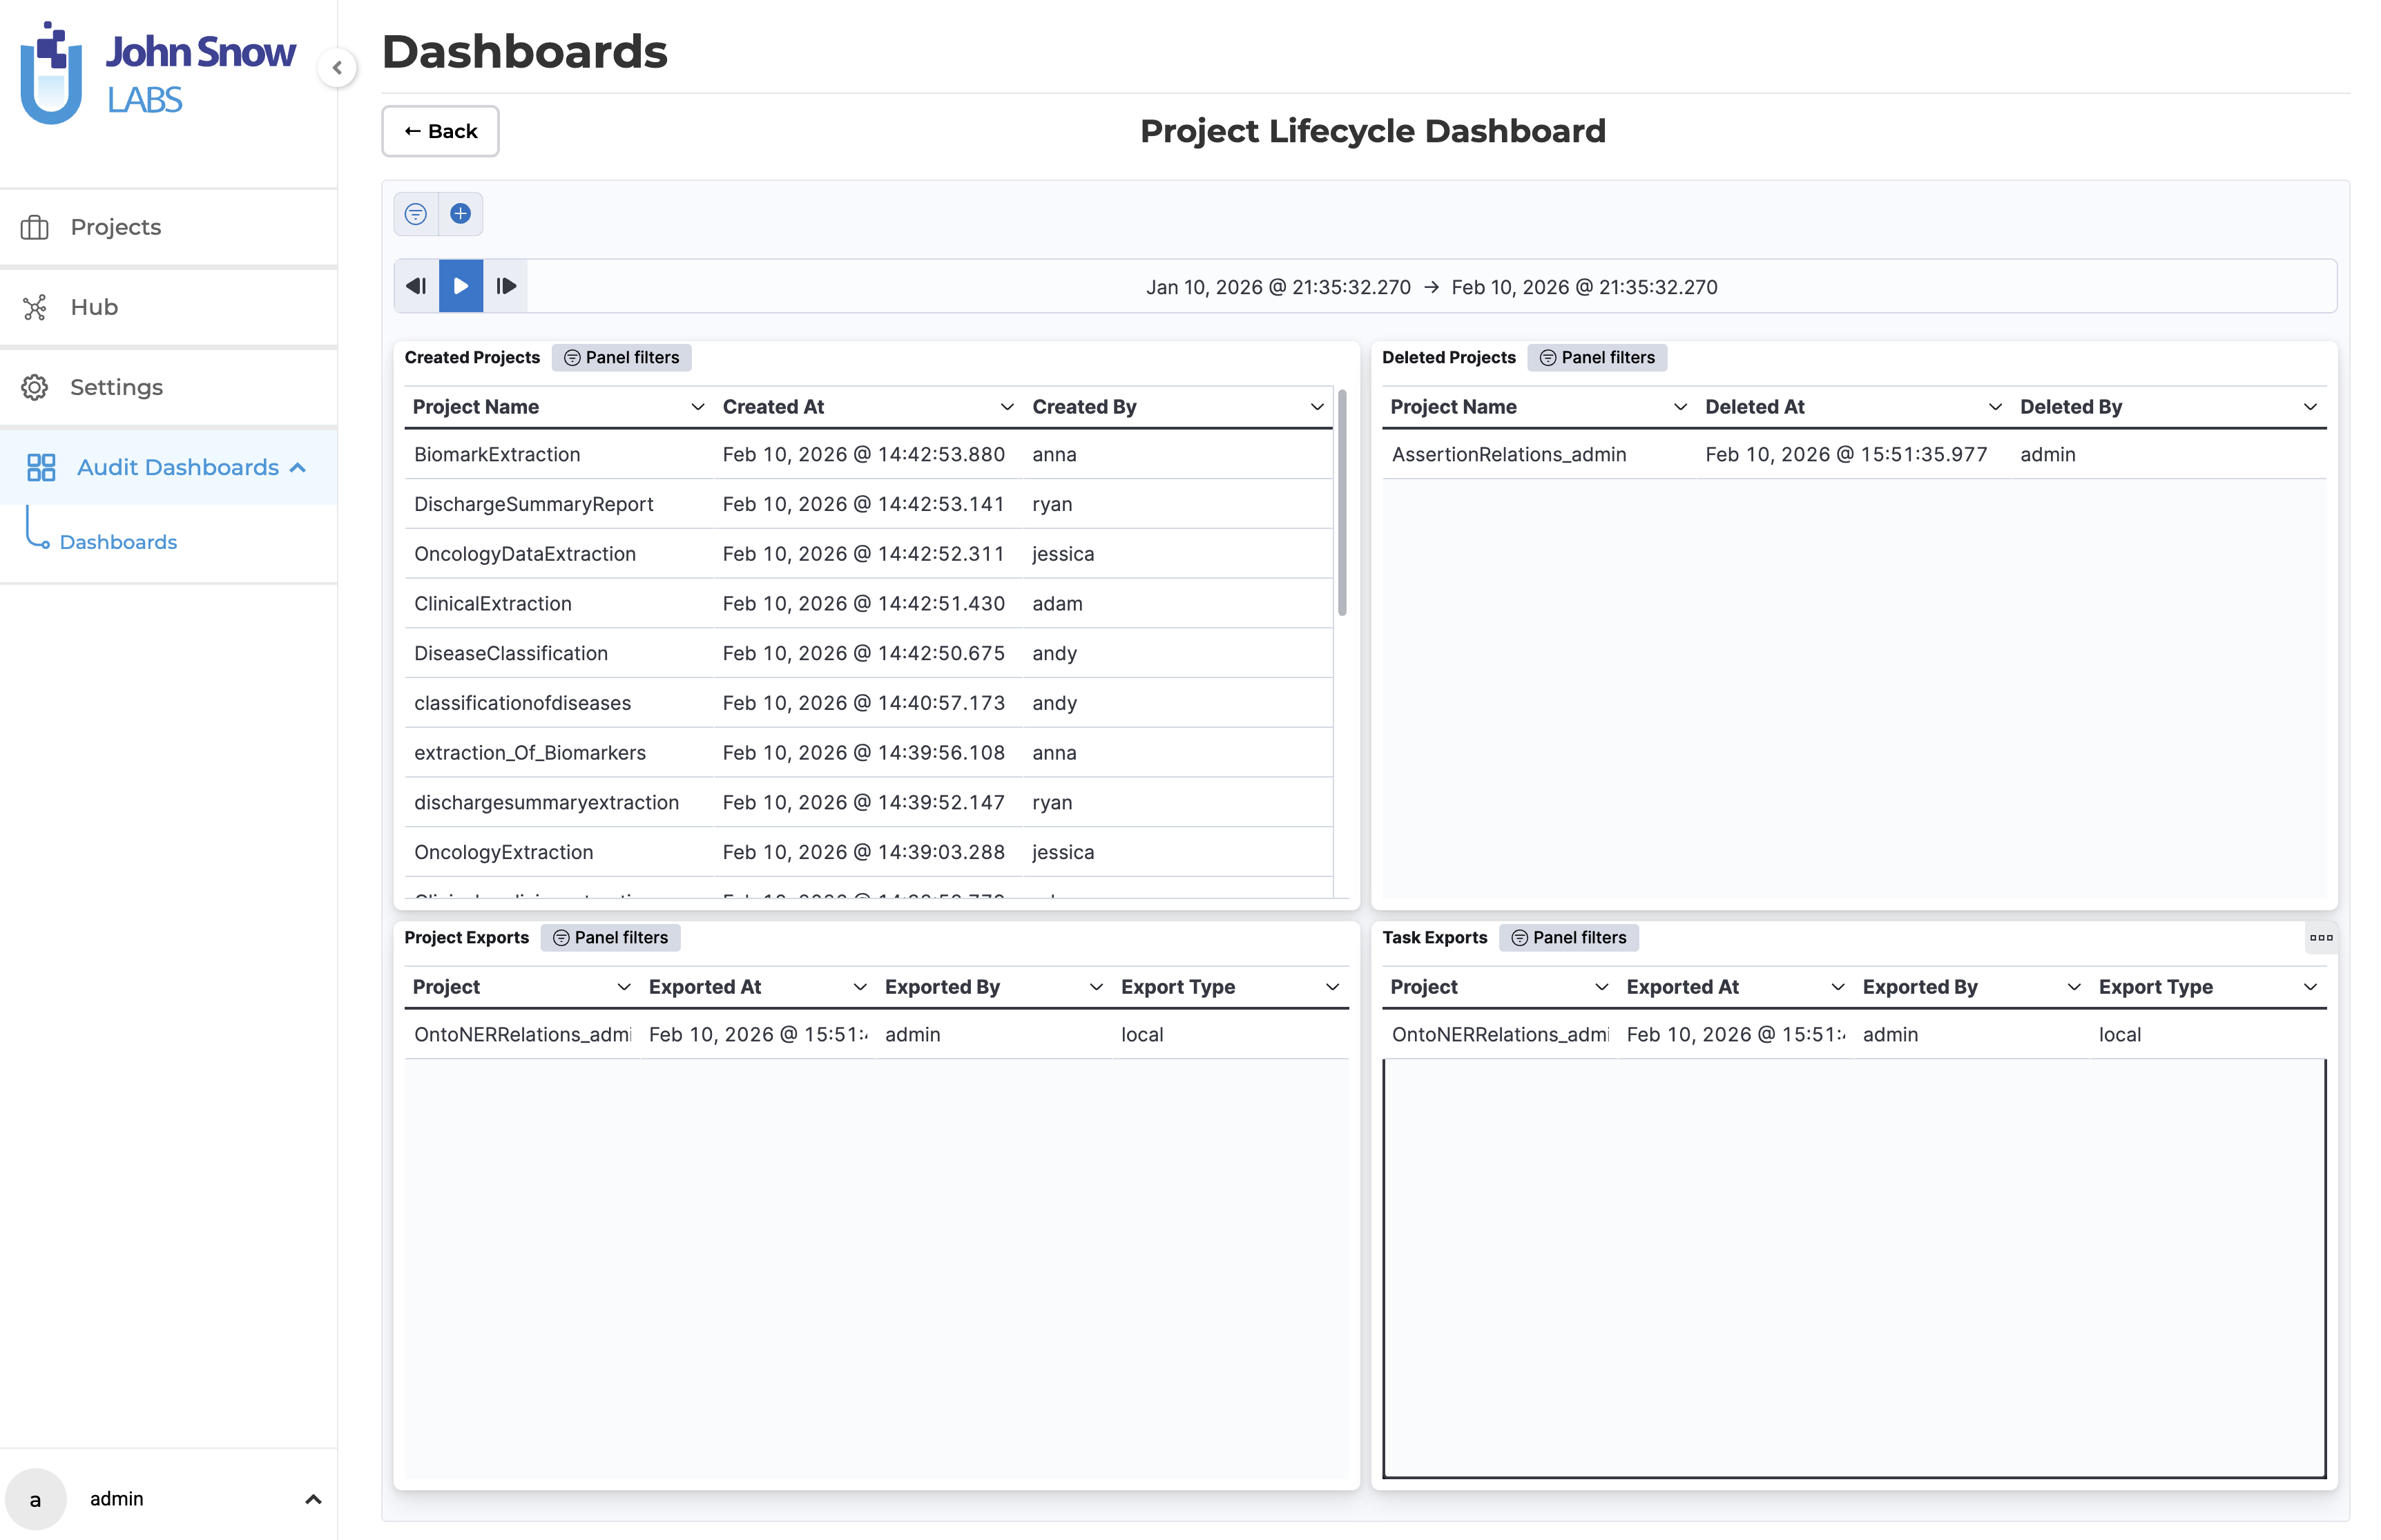
The dashboard is organized into purpose-built views that surface different aspects of platform activity:
- Project lifecycle tracking -monitors project creation, deletion, and export activity across the platform
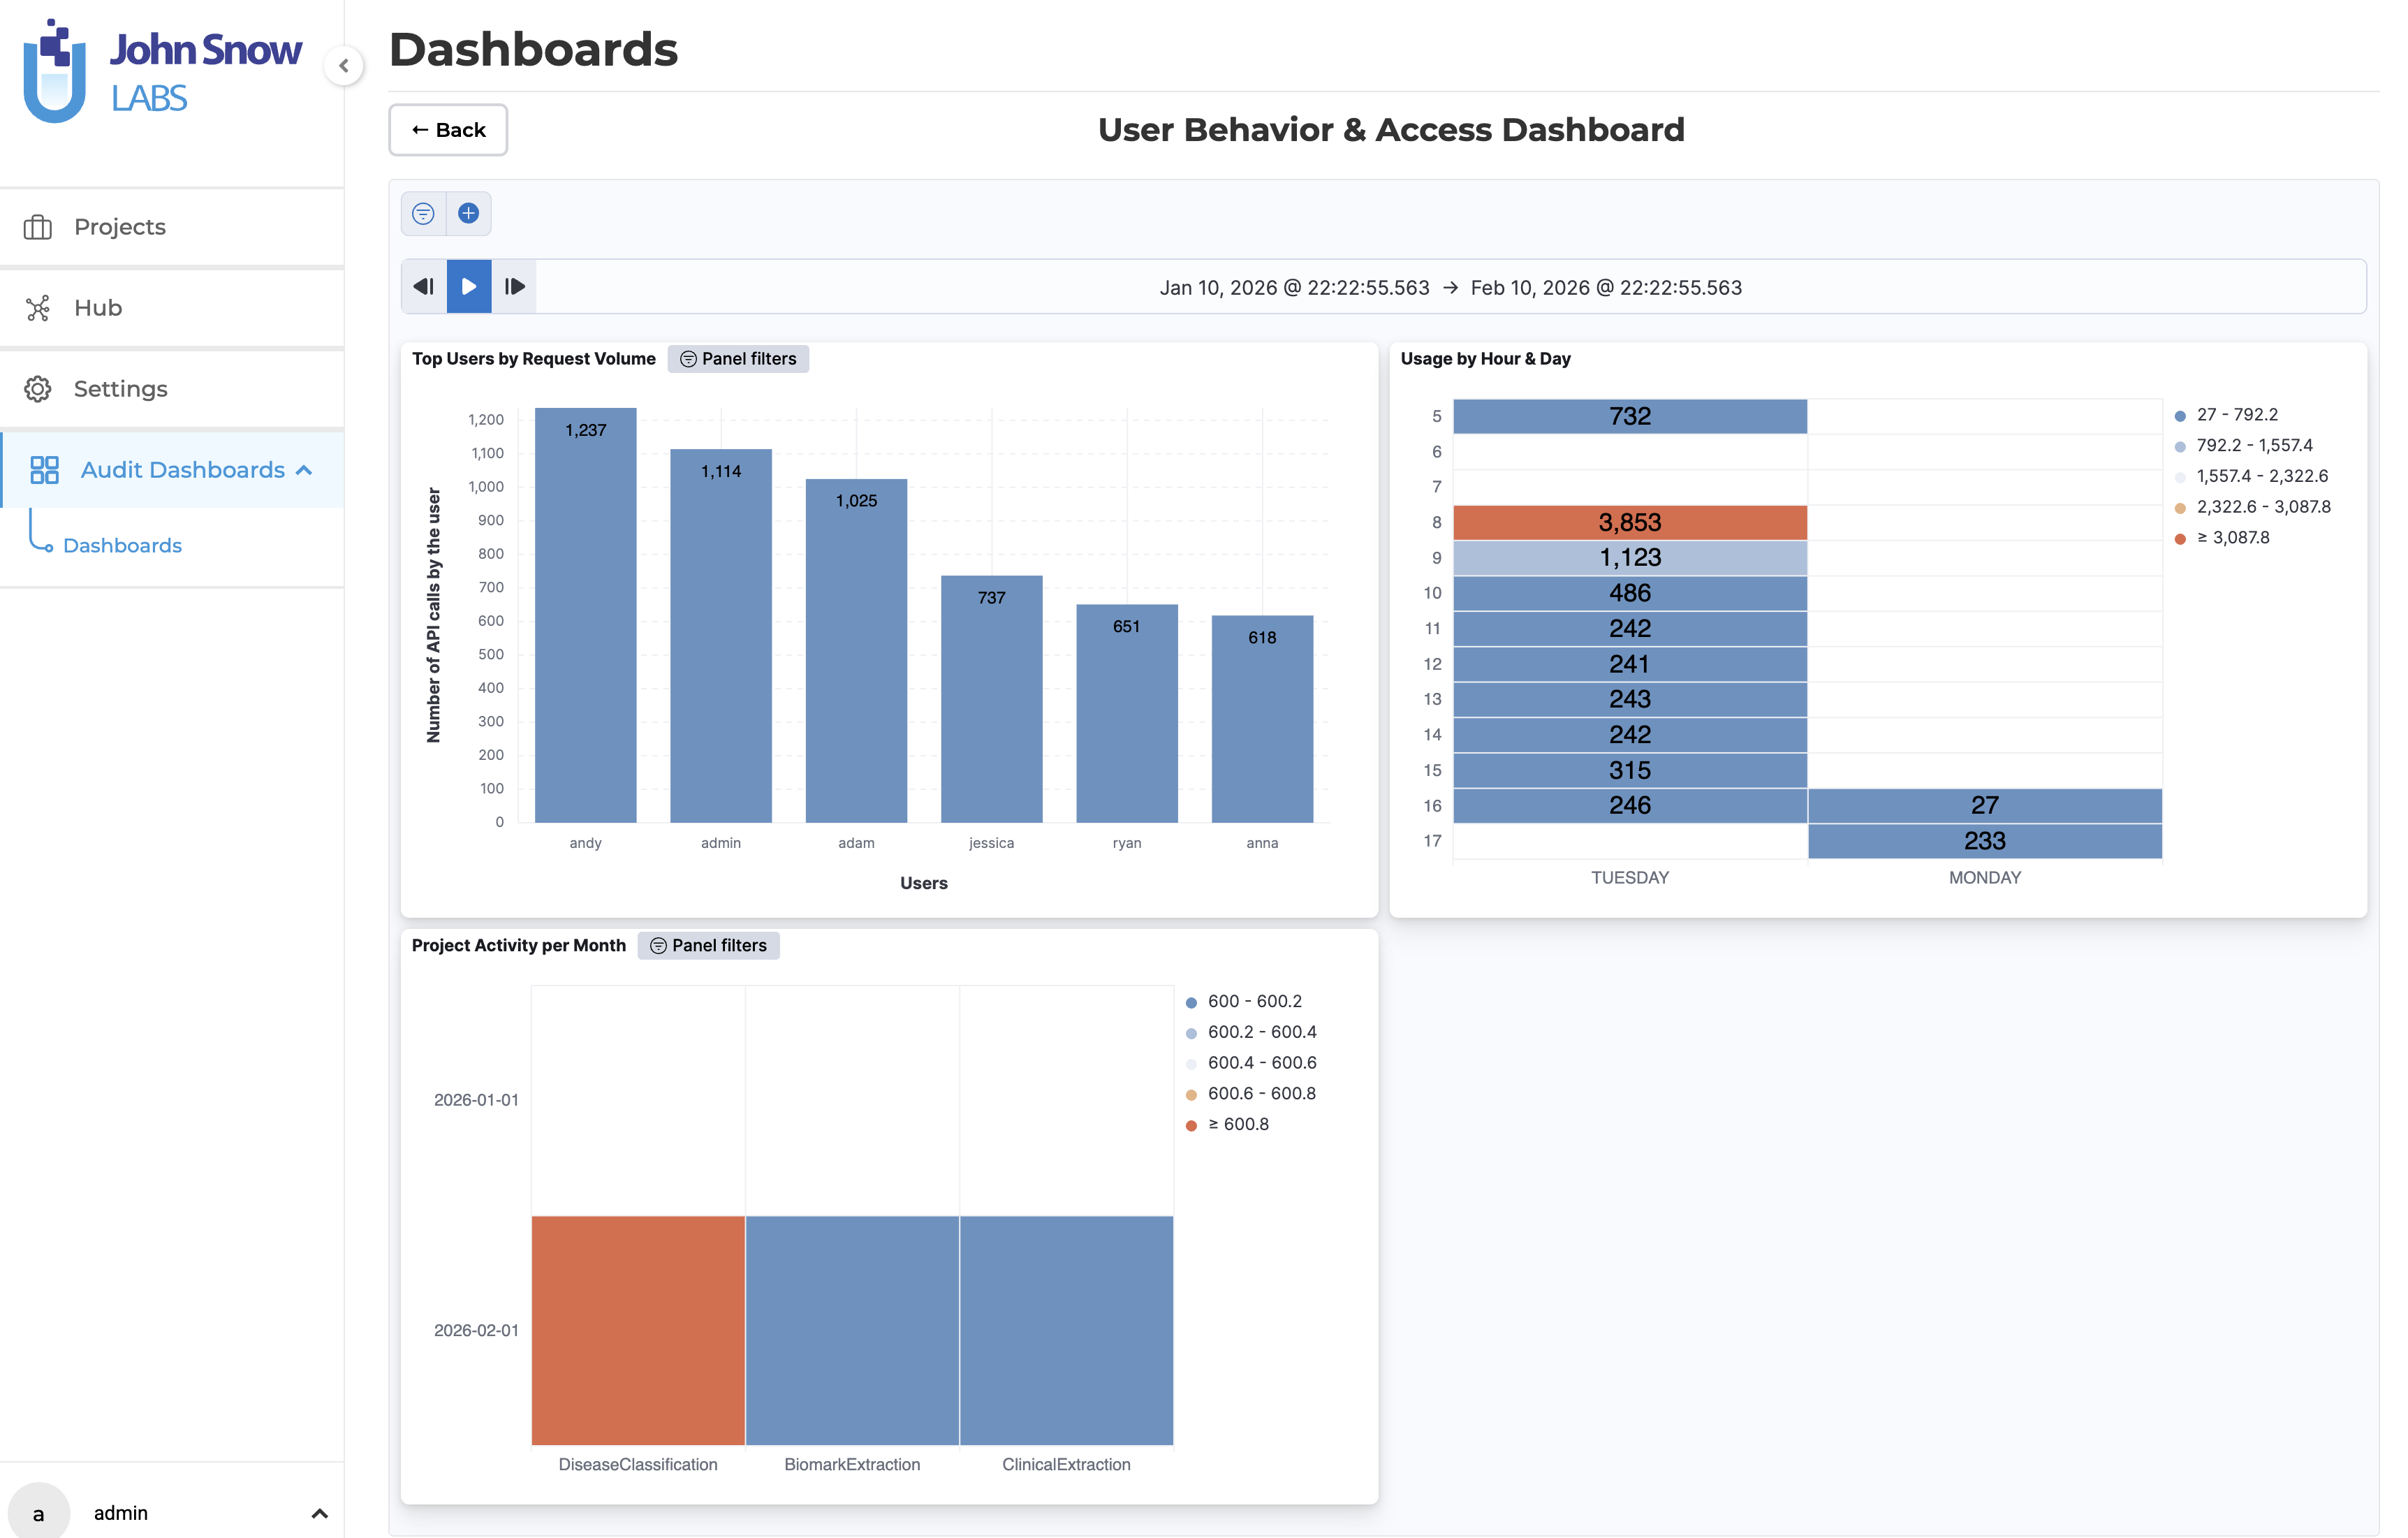
- User behavior analysis -ranks users by request volume, visualizes usage patterns by hour and day, and tracks per-project activity over time
- API and system monitoring -captures API usage trends, HTTP response codes, and platform-wide usage heatmaps
- Flexible filtering -narrows any view by project, user, event type, or date range to support targeted investigations
Technical Details
Under the hood, the Audit Logs Dashboard relies on an Elasticsearch backend to index and query event data. It is designed to operate transparently alongside existing platform services -once enabled, it begins capturing events without requiring changes to user workflows or project configurations.
- Activity Tracking: All critical system events are logged with timestamps tied to specific users, covering actions, data access, modifications, deletions, and exports
- Data Retention: Audit log retention is user-configurable, allowing organizations to align with internal policies and regulatory requirements
- Dashboards & Visualizations: Built-in views include project activity trends, new/deleted project tracking, export monitoring, API usage charts, HTTP status distributions, and user activity tables
- Customizable Views: Each dashboard panel supports filtering by project, user, event type, and date range for targeted audit reports
- Enablement: Audit logging is enabled globally via an installer flag; the Elasticsearch backend is automatically provisioned if not already present
Steps to Enable During Installation
- Run the installer with the audit logs flag:
./annotationlab-installer.sh --enable-audit-logs
- The system automatically provisions the necessary backend services (including Elasticsearch) if not already present.
Steps to Enable During Upgrade
- Run the updater with the audit logs flag:
./annotationlab-updater.sh --enable-audit-logs
- Existing services are updated, and audit logging is enabled without affecting existing data or configurations.
User Benefits
- HIPAA Compliance: Track access to PHI, modifications, and data exports for regulatory readiness
- Transparency & Accountability: Full visibility into user actions across projects and the platform
- Faster Troubleshooting: Quickly identify the root cause of issues or suspicious activity
- Data-Driven Insights: Monitor platform usage, detect anomalies, and optimize resource planning
- Easy Enablement: A single installer flag activates audit logging with automatic backend provisioning
Example Use Case
A compliance officer can use the Audit Logs Dashboard to investigate a spike in project deletions:
- Filter by project and date range to identify affected projects
- See which user performed each deletion and when
- Check for corresponding exports or modifications
- Review system-level activity to confirm whether the behavior was expected or anomalous
This workflow provides full visibility, accountability, and compliance assurance, reducing risk and simplifying investigations in regulated healthcare environments.
Improvements
Pipelines Now Scoped to Their Originating Project Type
What’s Improved
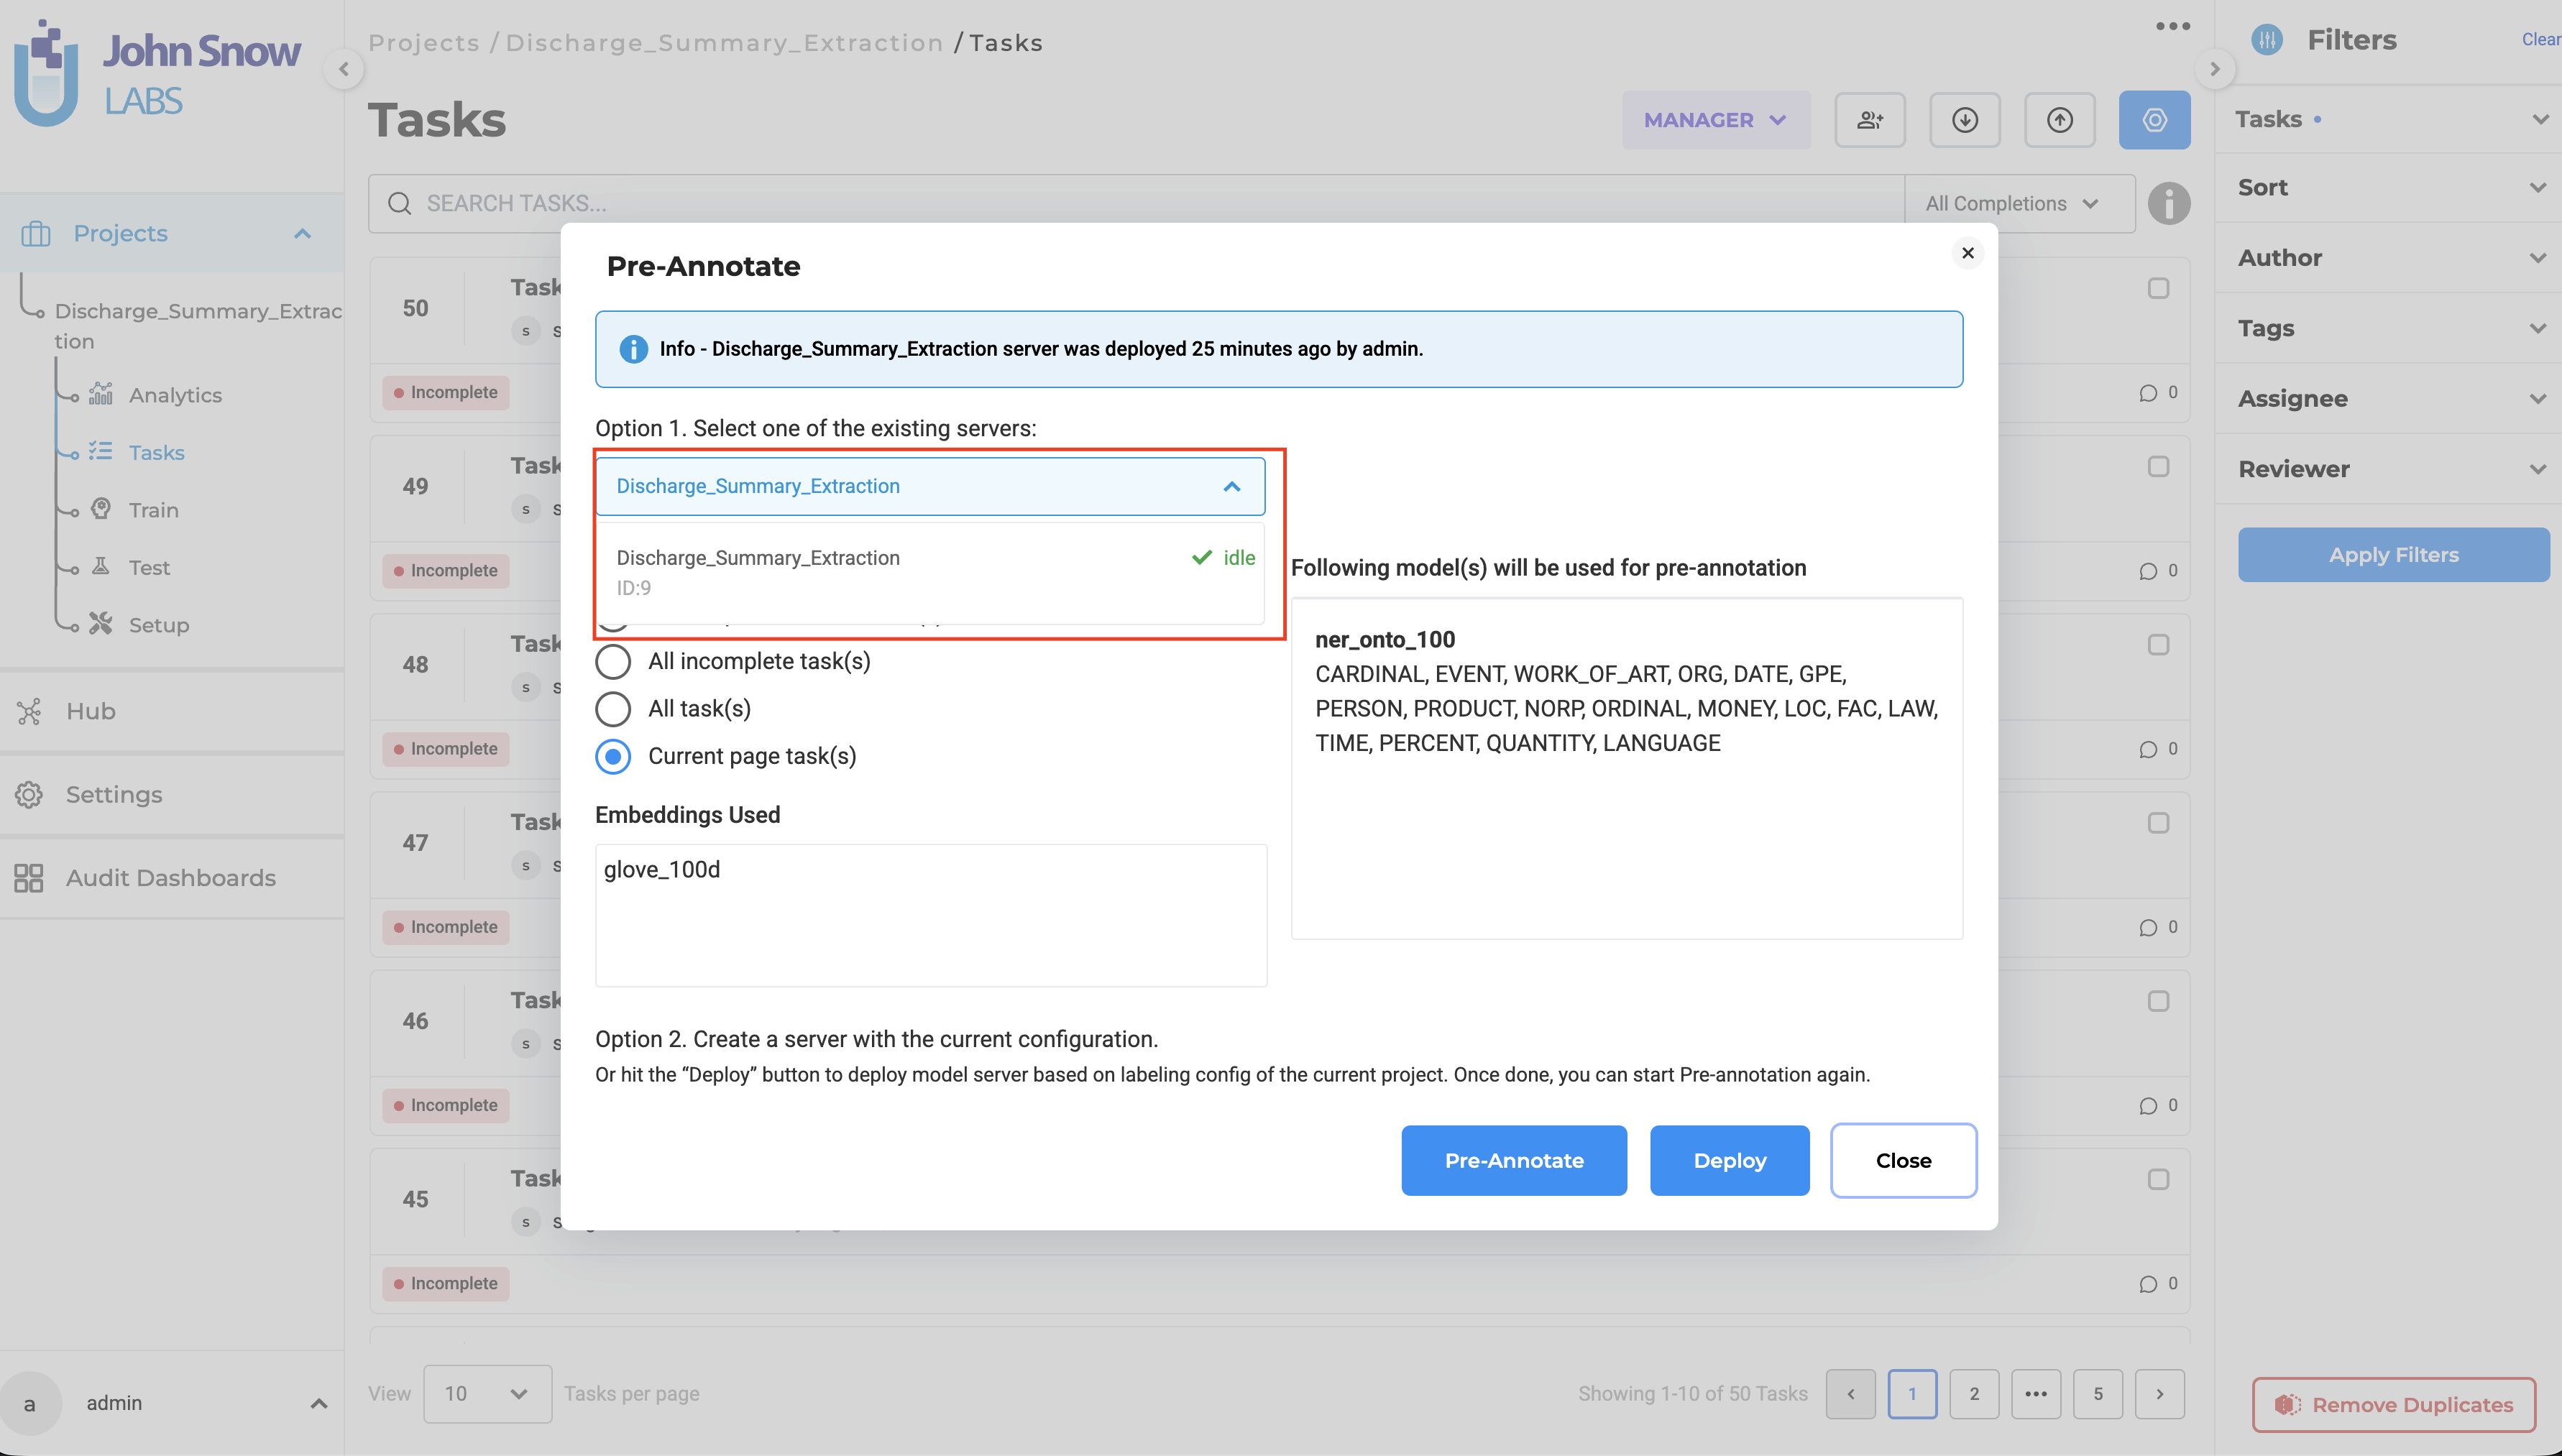
The pre-annotation modal now only lists servers and pipelines that were deployed within the same project type. Previously, a server deployed in one project type (e.g., Visual NER) would also appear as an available option in the pre-annotation modal of other project types (e.g., NER), which could lead to confusion and accidental selection of an incompatible pipeline. With this change, opening the pre-annotation modal in an NER project will only show NER-compatible resources, and the same applies to Visual NER and other project types.
Technical Details
- Pipeline visibility is restricted to the project type where the deployment was performed.
- Cross-project-type pipeline listing has been removed.
- The filtering logic is applied consistently across all deployment and selection workflows.
User Benefits
- Reduced errors: Prevents accidental selection of incompatible pipelines.
- Clearer workflow: Users see only pipelines relevant to the project type they are working in.
- Better consistency: Maintains clear separation between NER, Visual NER, and other project workflows.
Example Use Case
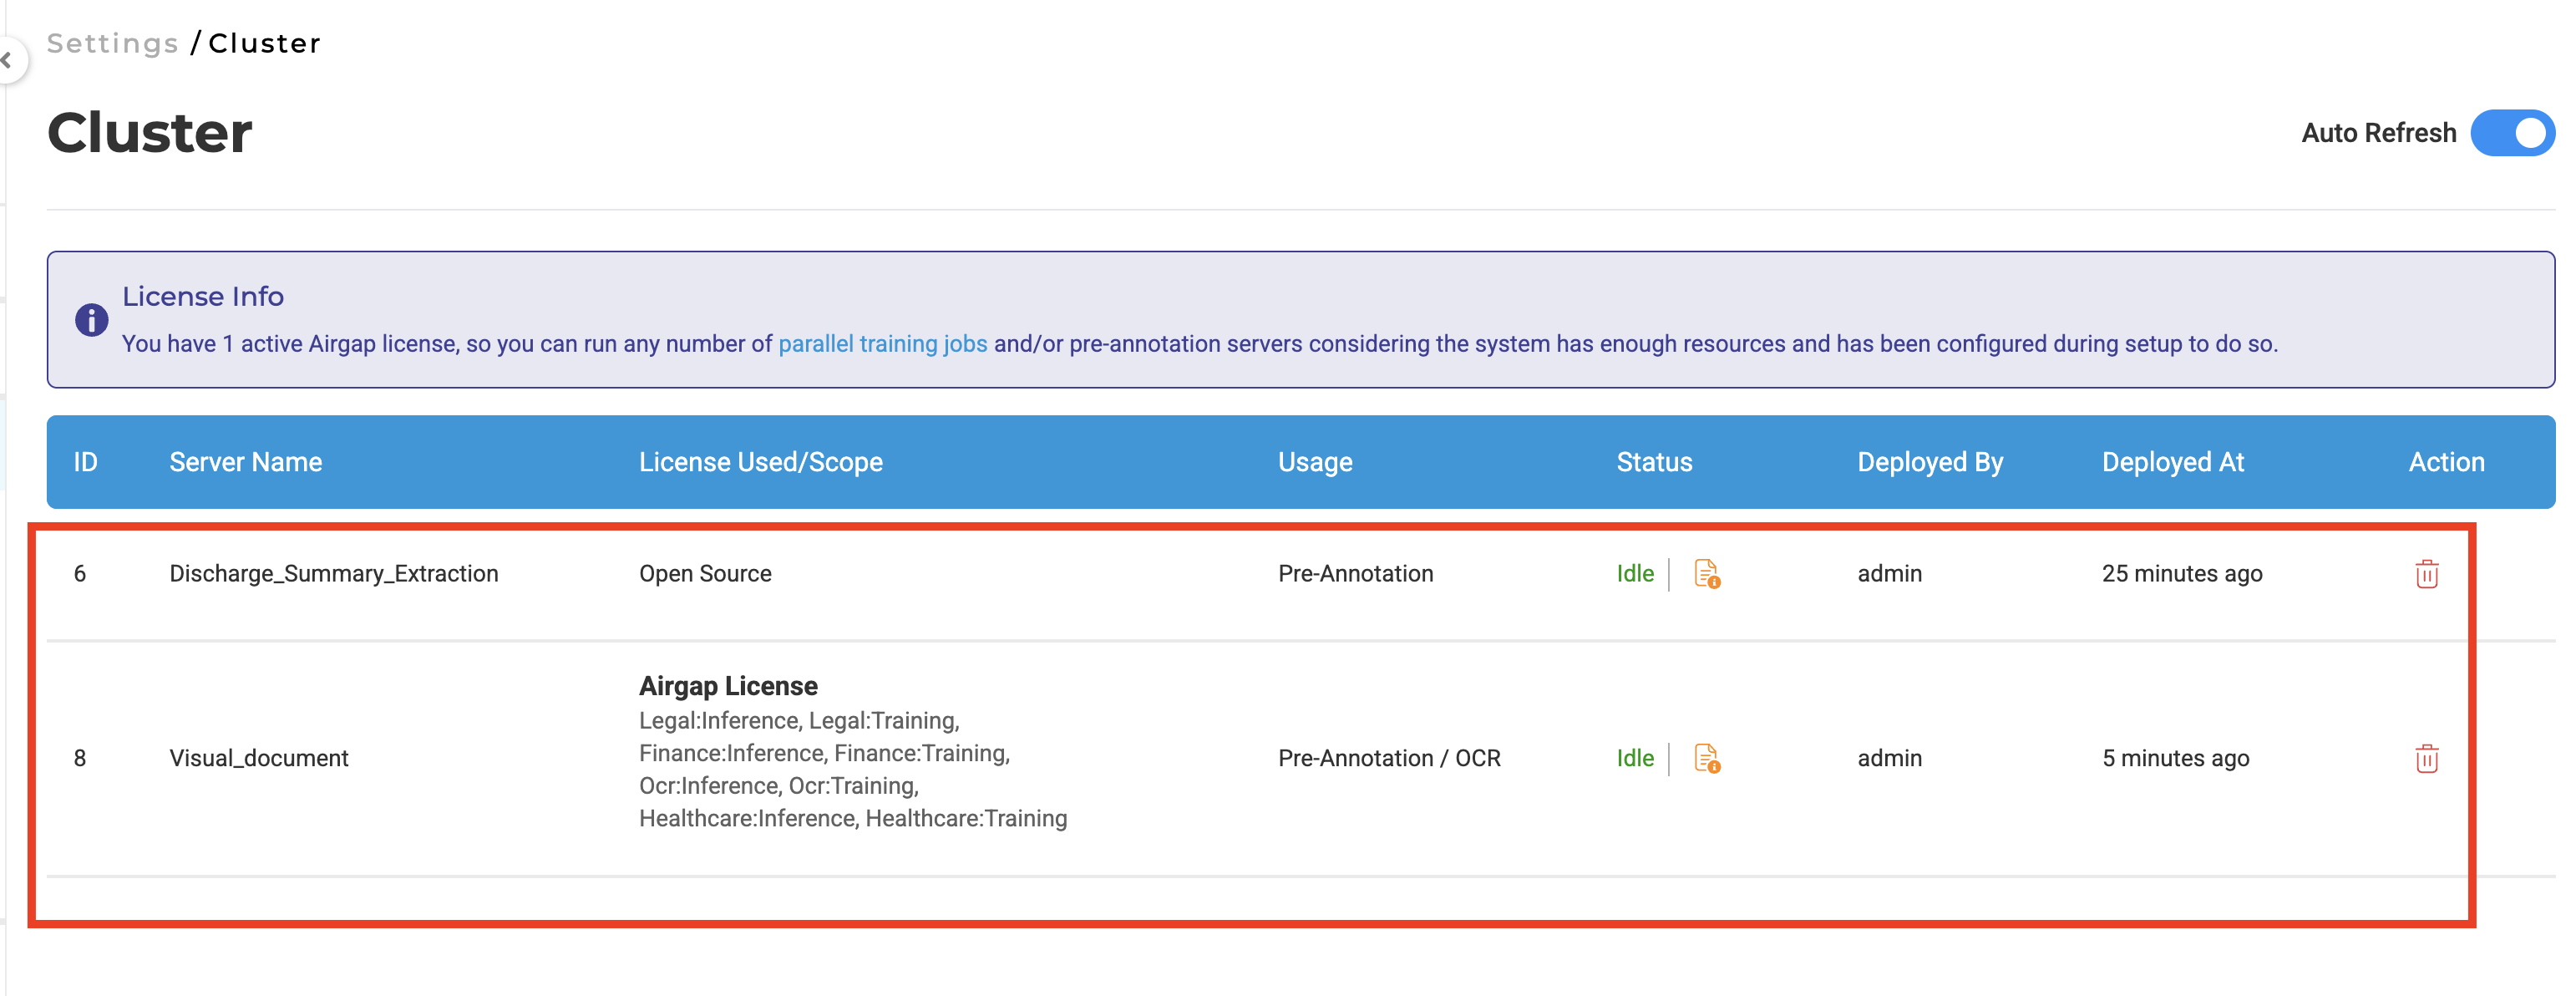
A user deploys a Visual NER server for preannotation or OCR of PDF documents. When working in an NER project, this pipeline will no longer appear in the pre-annotation selection list, ensuring that only compatible pipelines are available for use.
Pre-Annotation Deployment Now Shows Continuous Progress Feedback
What’s Improved
Previously, clicking Deploy in the pre-annotation modal would immediately close the dialog, leaving users with no indication of whether the server was still starting up. The modal now remains open throughout the deployment process, displaying real-time status updates until the server is ready.
Technical Details
- The pre-annotation pop-up remains visible while the server is initializing, instead of closing immediately after deployment is triggered.
- If the pop-up is manually closed, the Pre-Annotate button displays a loading indicator to reflect the ongoing deployment state.
- The button remains interactive and automatically updates once the server is ready, reappearing in its active state to indicate availability.
- UI state handling has been refined to ensure accurate synchronization between deployment progress and user-facing indicators.
User Benefits
- Clear, continuous visibility into pre-annotation deployment status.
- Reduced confusion about whether deployment is still in progress.
- Consistent and accurate UI feedback, even if the pop-up is closed.
- Smoother and more transparent pre-annotation workflow.
Example Use Case
A user triggers pre-annotation on a large project and monitors the deployment process. While the server is starting, the pop-up remains open to show progress. If the user closes the pop-up to continue working elsewhere, the Pre-Annotate button clearly indicates that deployment is still in progress and updates automatically once the server is ready.
Playground Now Reports Pre-Annotation Test Outcomes
What’s Improved
The Playground now provides clear, immediate feedback when a pre-annotation test finishes. Users are explicitly notified whether the test succeeded with results, completed without producing any matches, or failed -removing ambiguity that previously required manual inspection to resolve.
Technical Details
The Playground displays outcome-based status notifications after a pre-annotation run finishes. The system evaluates the execution result and surfaces a contextual message using color-coded visual cues:
- A green success message is shown when pre-annotation completes and generates results.
- An orange informational message appears when pre-annotation completes successfully but no annotations are found.
- A red failure message is displayed when the pre-annotation process fails.
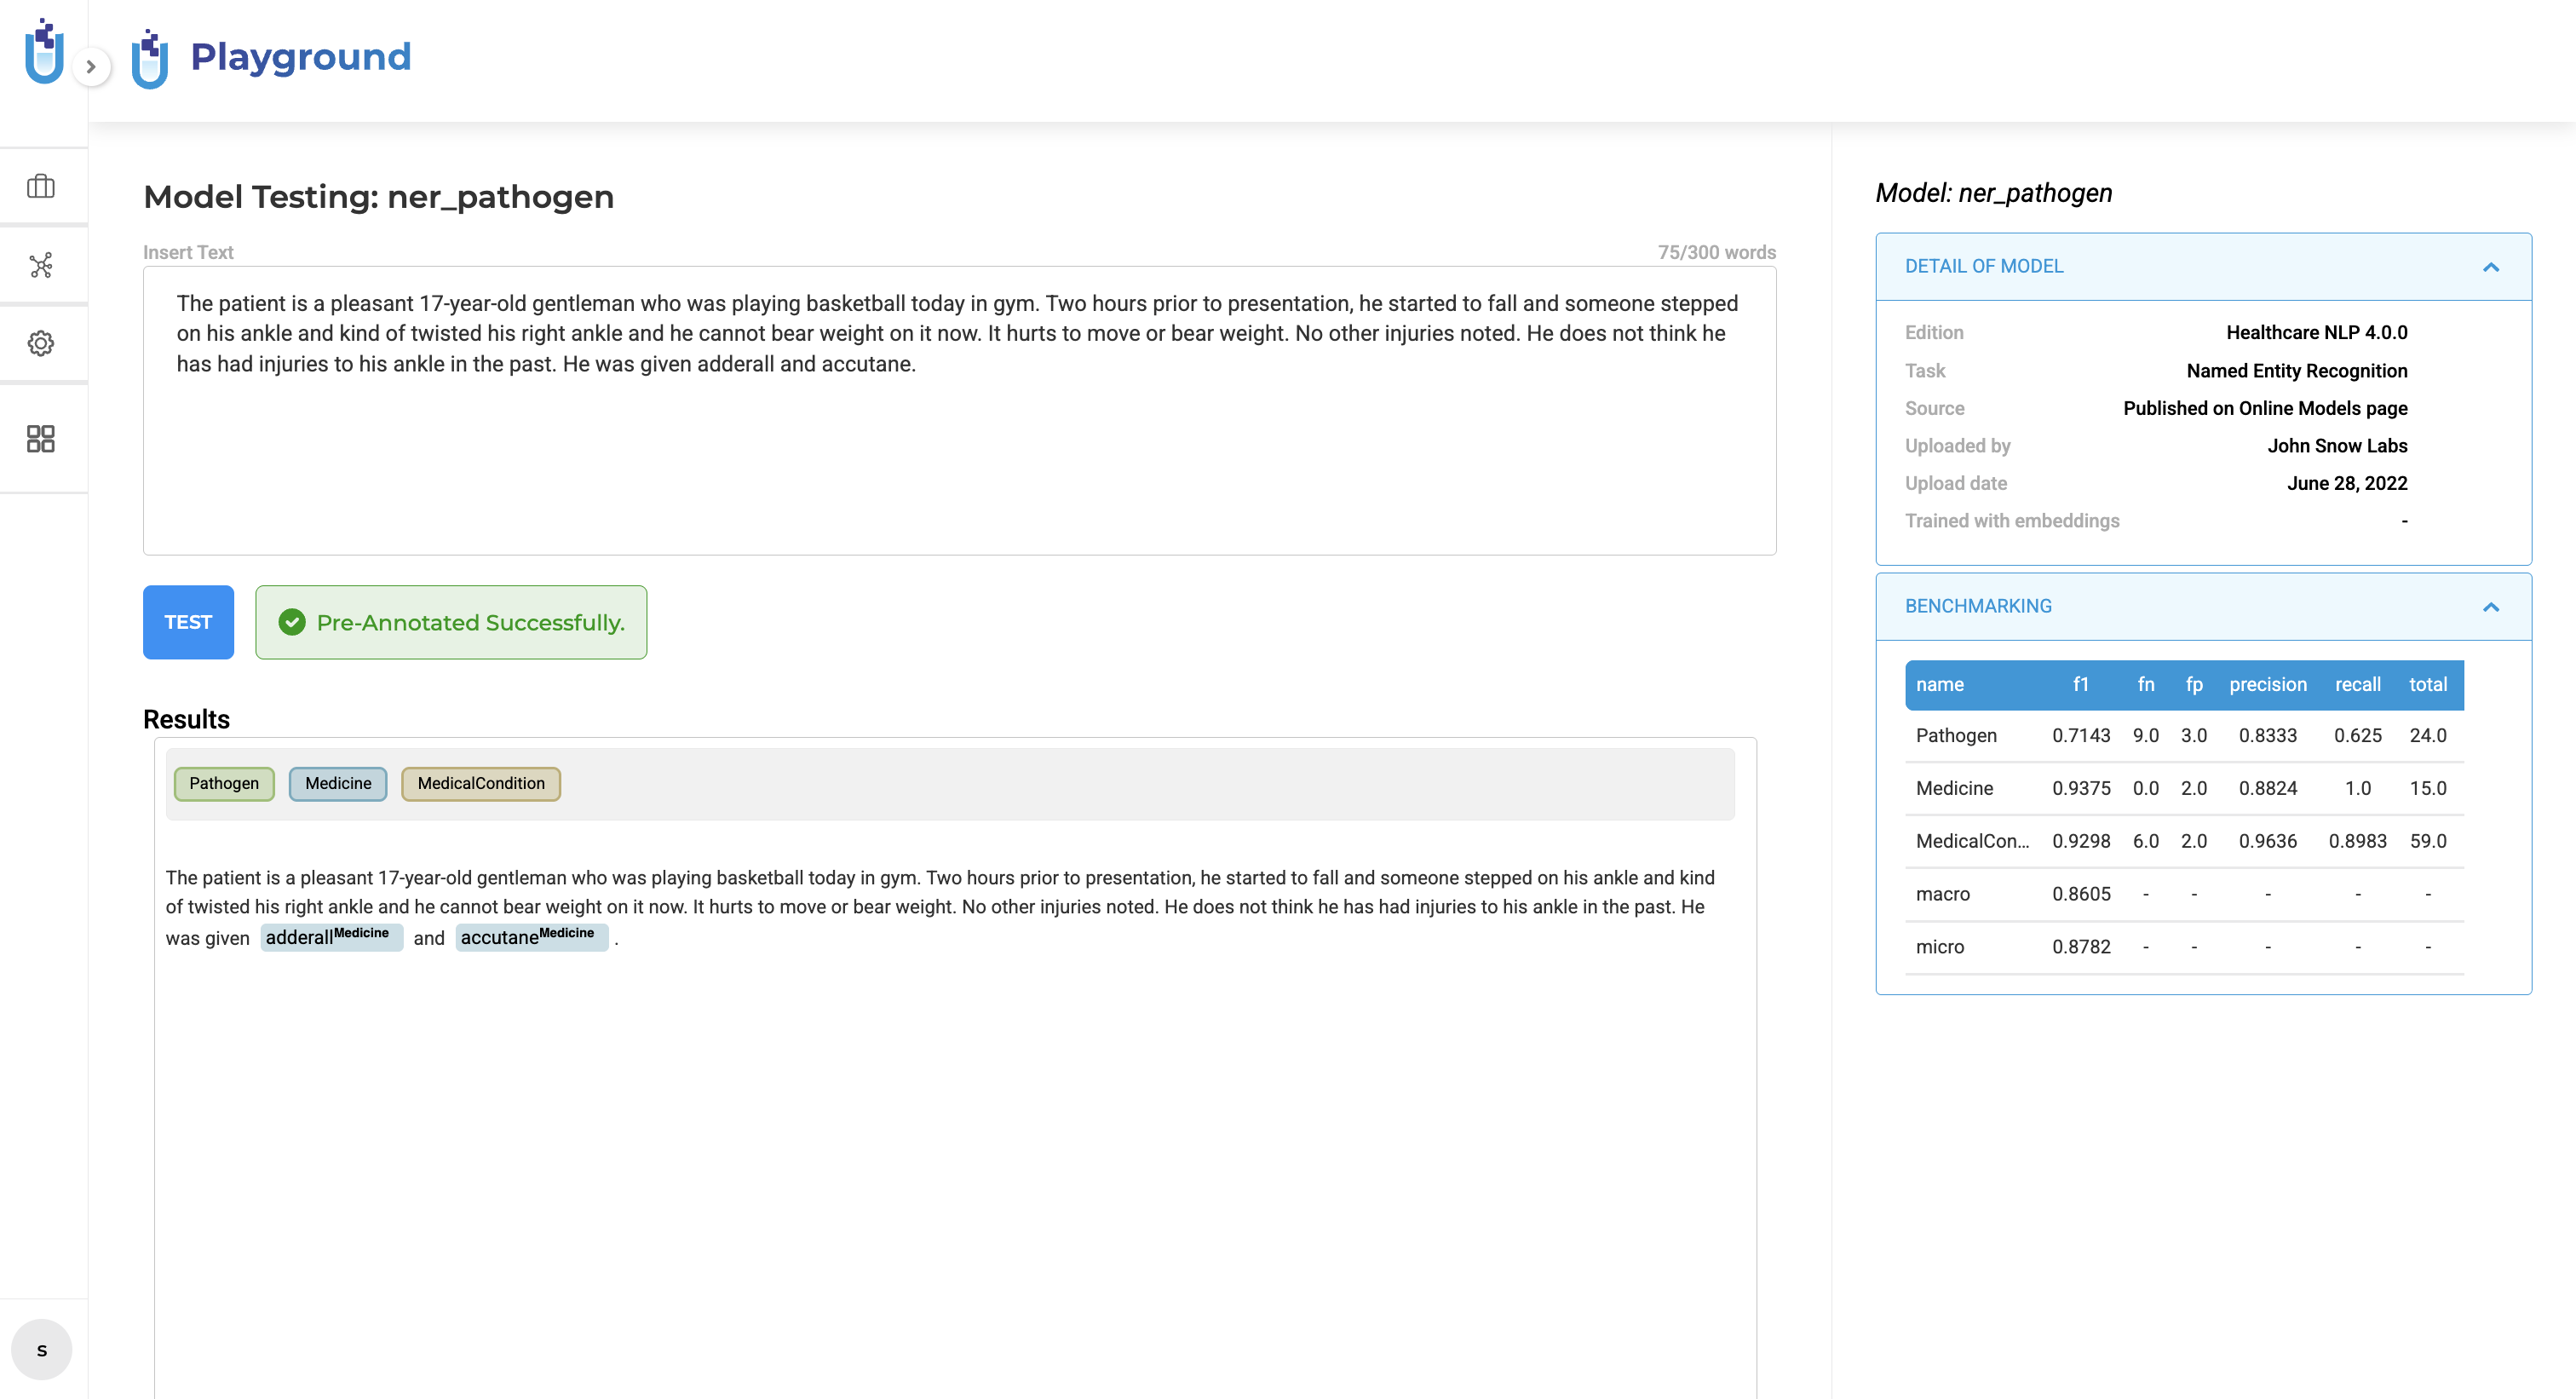
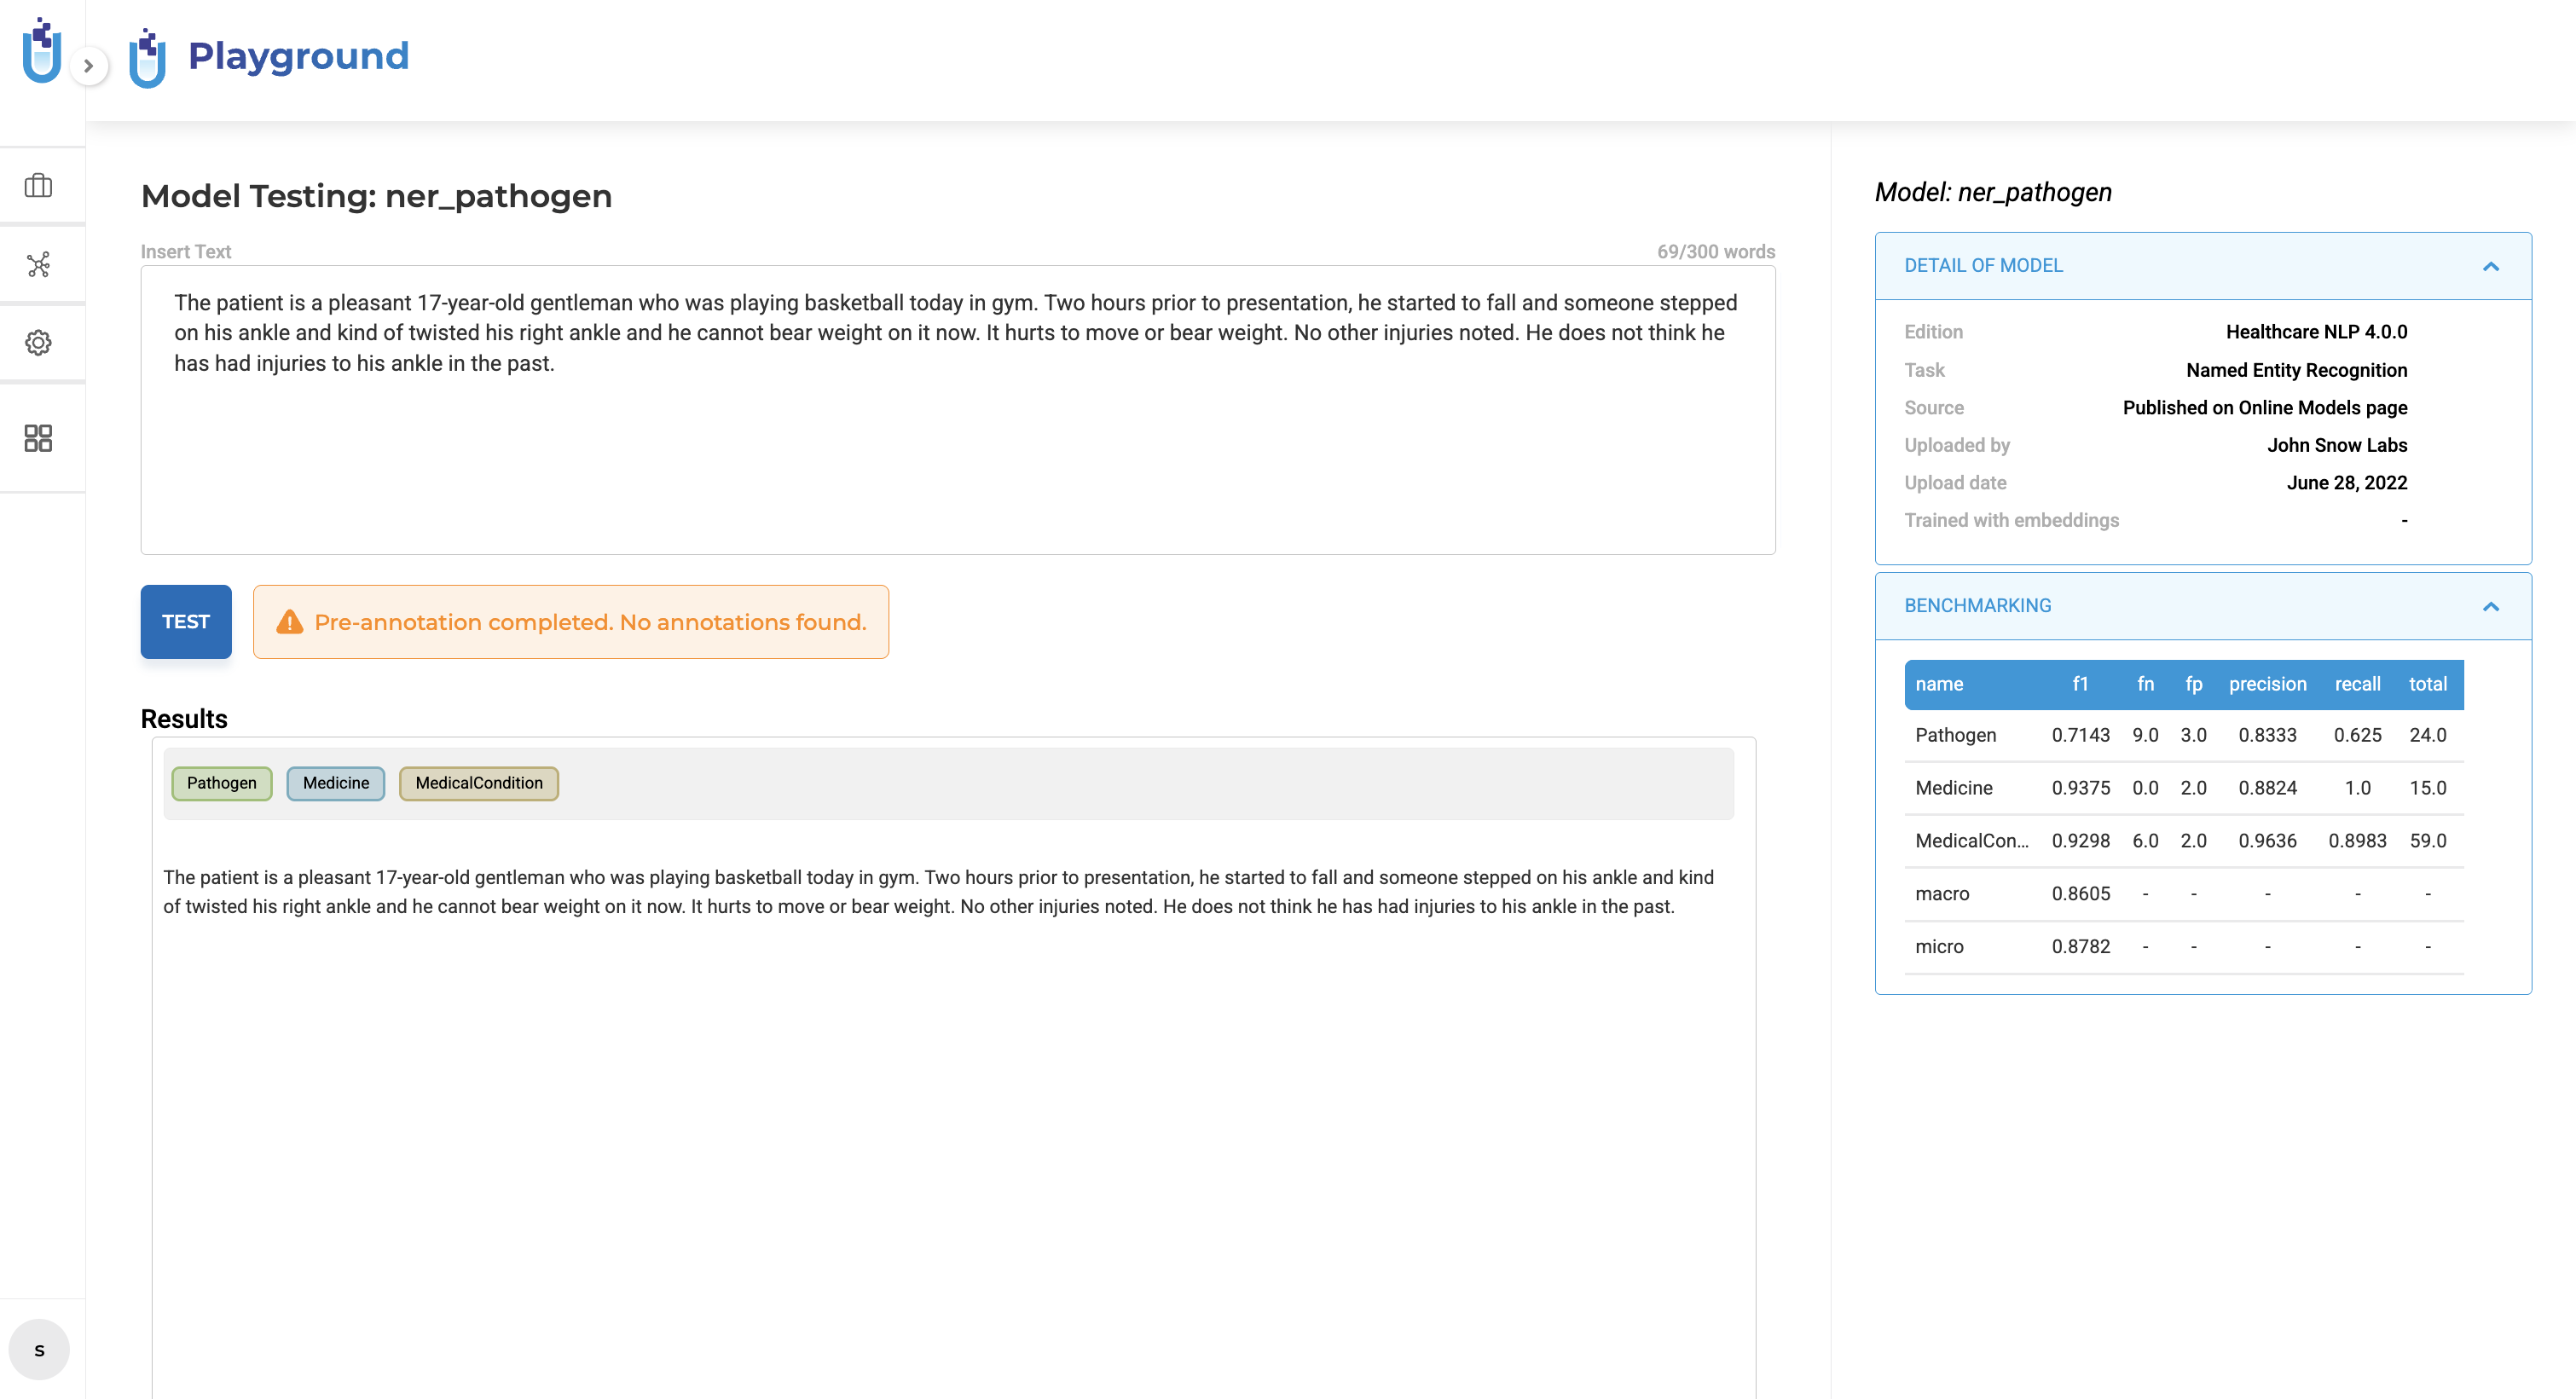
These notifications appear immediately upon completion and do not alter the existing pre-annotation execution flow or configuration.
User Benefits
- Clear visibility into whether a pre-annotation test produced results, found nothing, or failed.
- Faster decision-making about whether to proceed, adjust the input text, or troubleshoot.
- Reduced confusion when a test completes but produces no output.
- Improved confidence when experimenting with models, rules, or prompts in the Playground.
Example Use Case
A user runs a pre-annotation test in the Playground to validate a model before adding it to a project. Once the test completes, the Playground clearly indicates the outcome -confirming success with generated results, signaling a successful run with no matches, or highlighting a failure -allowing the user to immediately decide the next step.
Click-to-Navigate Behavior for Comments
What’s Improved
Clicking on a comment now automatically scrolls to and highlights the exact location in the task where the comment was originally placed. This eliminates the need to manually search through a document to find the content a comment refers to, making review workflows significantly faster.
Technical Details
- Comment click behavior now includes positional mapping between comments and their associated content.
- When a comment is selected, the system scrolls to the corresponding section in the task.
- The relevant text or area is brought into view and visually highlighted to clearly indicate the comment’s context.
- This enhancement applies to previously added comments without requiring any data migration or user action.
User Benefits
- Instant navigation to the content a comment refers to, without manual searching.
- Improved review and collaboration experience, especially in long documents.
- Reduced confusion when navigating tasks with multiple comments.
- Works with existing comments -no migration or reconfiguration needed.
Example Use Case
During task review, a user clicks on a comment discussing an issue in a specific section of the document. Instead of manually scrolling to locate the referenced content, the system automatically navigates to and highlights the exact section, allowing the user to immediately understand and act on the feedback.
Responsive Analytics Charts for Smaller Screens
What’s Improved
Analytics charts now render correctly on smaller screens and laptops. Chart elements that previously overlapped in constrained viewports -such as labels, legends, and chart regions -are now displayed clearly at standard zoom levels, maintaining readability and visual consistency.
Technical Details
The layout and spacing logic for Analytics charts has been refined to better adapt to smaller screen sizes. Chart regions, labels, legends, and visual elements now adjust dynamically to the available screen space, preventing overlap and preserving the intended structure of each visualization.
User Benefits
- Clear and readable charts on smaller screens and laptops.
- No overlapping labels, legends, or chart regions at normal zoom levels.
- More reliable analytics viewing without needing manual zoom or window resizing.
- Consistent visual experience across devices.
Example Use Case
A user reviews analytics on a laptop or a smaller monitor. With the updated responsive behavior, all chart elements are clearly visible and properly spaced, allowing users to interpret metrics without adjusting the zoom or switching devices.
Scrollbar Navigation for Visual NER Documents
What’s Improved
The Visual NER document viewer now includes both horizontal and vertical scrollbars, making it easier to navigate large or high-resolution documents without relying solely on the drag-to-reposition feature.
Technical Details
The visual document viewer now supports native horizontal and vertical scrolling. Scrollbars appear automatically for documents that extend beyond the visible viewport, enabling smooth navigation in all directions. This enhancement works alongside existing interaction features and does not change the underlying document rendering or annotation behavior.
User Benefits
- Easier and more intuitive navigation for large or zoomed-in visual documents.
- Reduced reliance on the drag-to-reposition feature.
- Faster access to different areas of a document during review or annotation.
- Improved usability for complex or high-resolution files.
Example Use Case
An annotator working on a large scanned form needs to review content across multiple sections of the page. With the newly added scrollbars, the annotator can smoothly navigate to any part of the document using standard scrolling, making the review process more efficient.
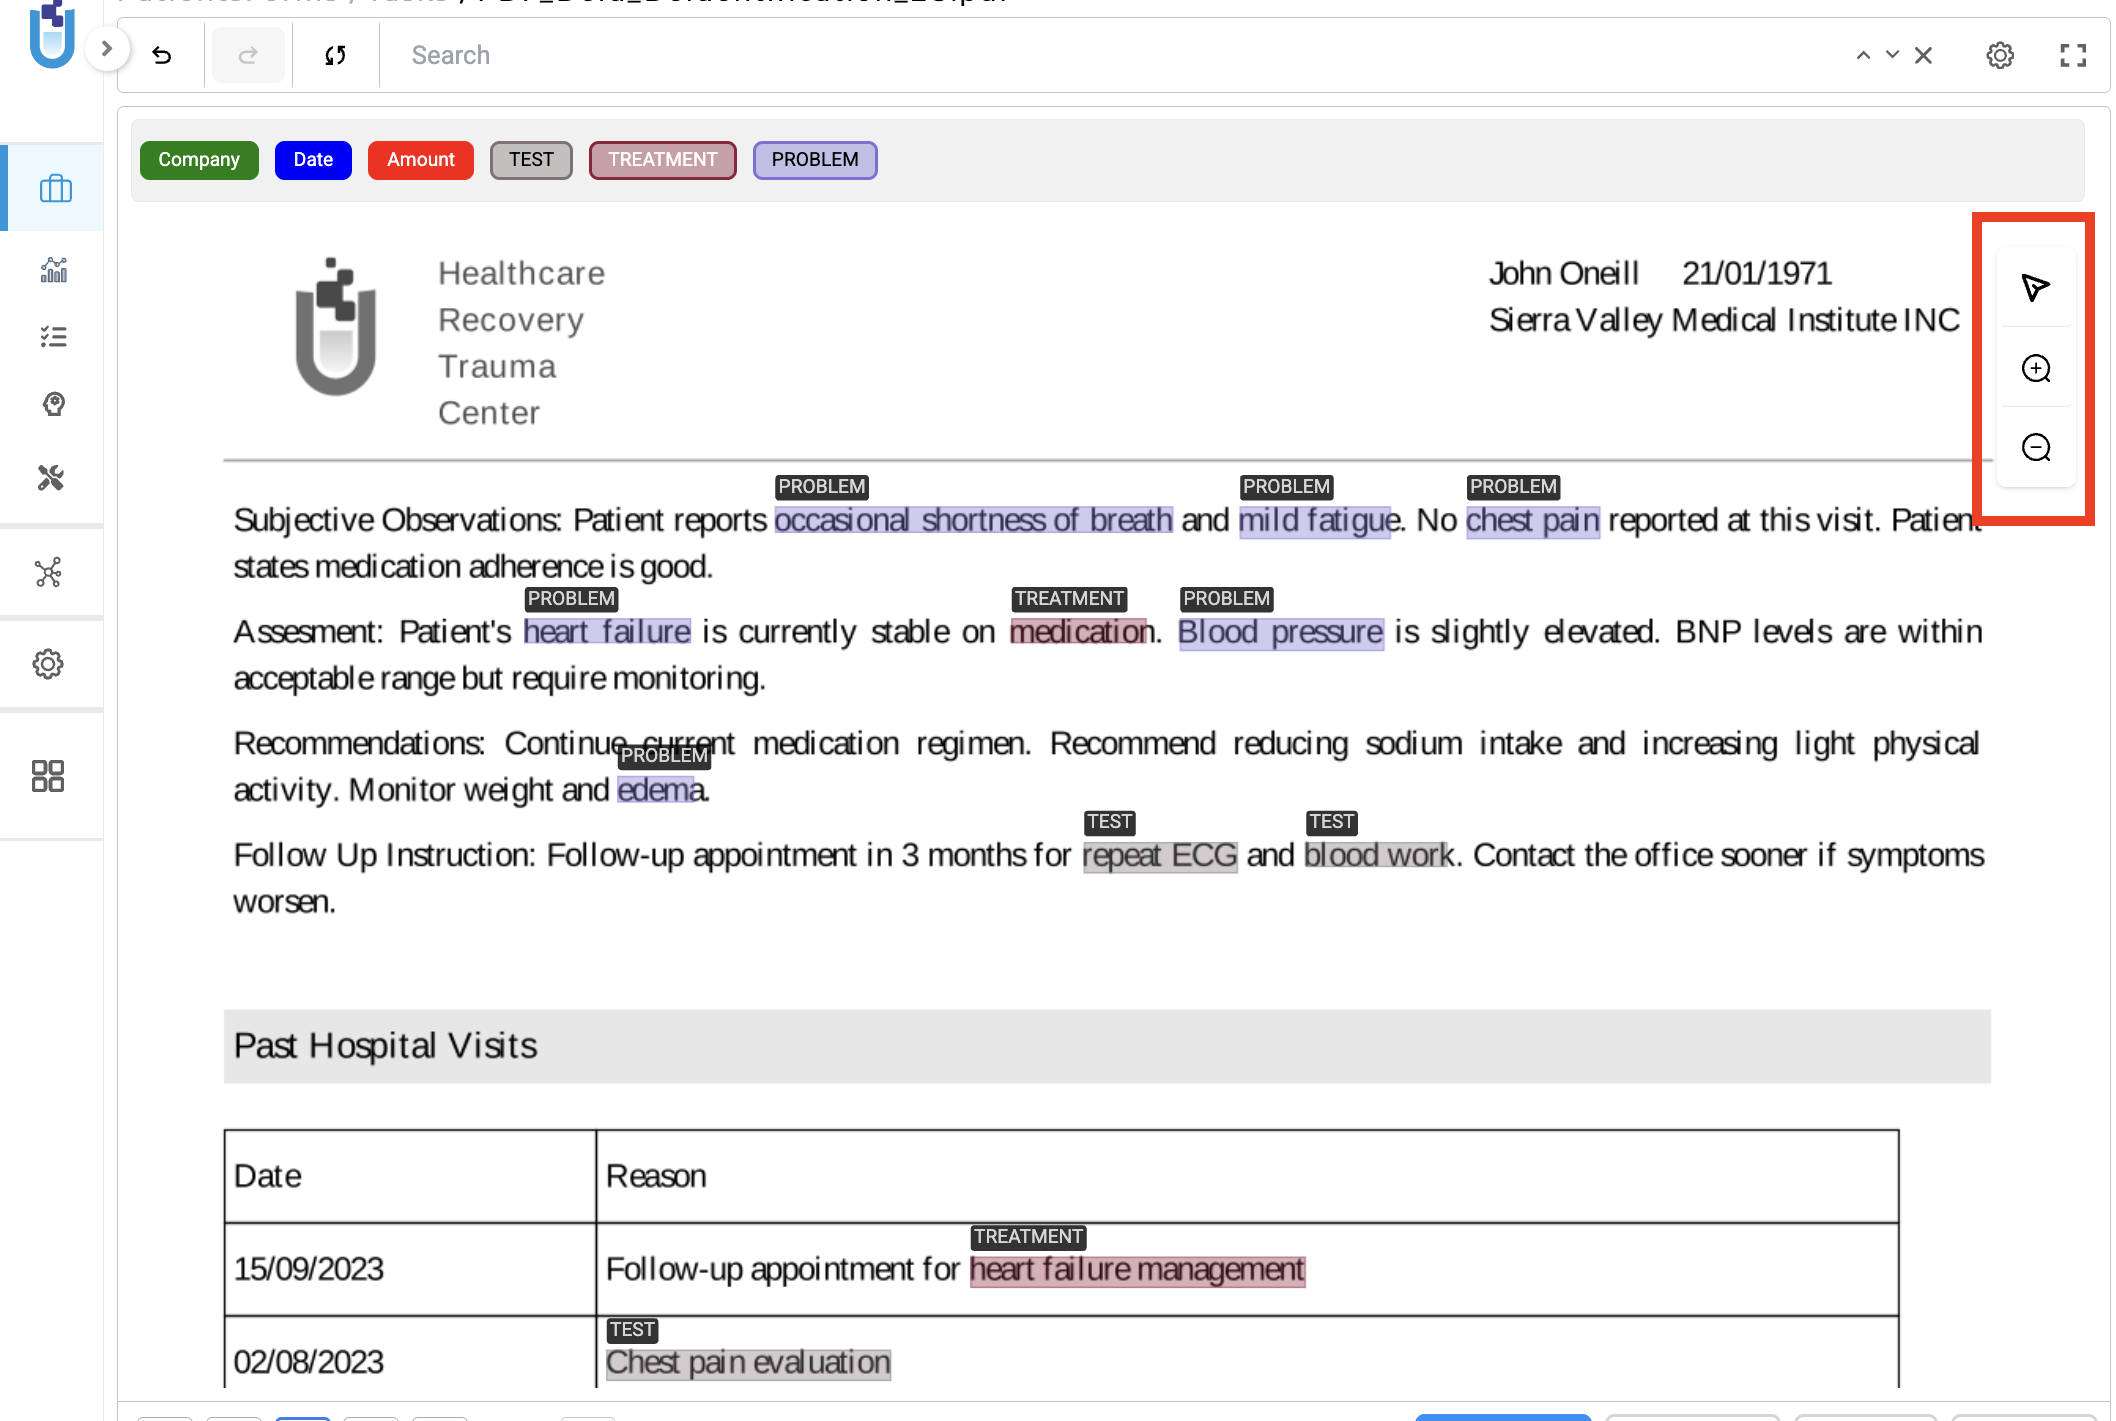
Updated Zoom and Pan Controls for Visual Projects
What’s Improved
The zoom in, zoom out, and move/pan controls in Visual Projects have been updated with clearer button designs, making them easier to discover and use when working with PDF and image-based documents.
Technical Details
The document viewer toolbar for Visual Projects has been enhanced with updated controls for zooming and repositioning content. These controls are now more clearly presented and consistently available when working with PDF and image documents. The underlying zoom and pan functionality remains unchanged, ensuring full backward compatibility with existing workflows.
User Benefits
- Improved clarity and discoverability of zoom and move controls.
- Smoother interaction when inspecting PDFs and image documents.
- Reduced friction when switching between navigation actions.
- Consistent viewing experience across Visual Projects.
Example Use Case
While reviewing a scanned PDF in a Visual Project, a user frequently zooms in to inspect fine details and repositions the document to continue annotation. With the updated controls, these actions are quicker and more intuitive, allowing the user to stay focused on the review task.
Bug Fixes
UI & User Experience
-
Stable UI when renaming a service provider to a duplicate name
Previously, renaming a service provider to an already existing name could cause brief UI shifts or visual glitches during validation. The interface now remains stable and displays a clear toast error message when a duplicate name is detected.
-
Comments no longer trigger a redirect to the error page
Selecting Comments in the Annotation section could trigger an unintended redirect to a “Something went wrong” page. This has been corrected, and comments can now be accessed reliably.
-
Classification and comments now visible for previously annotated chunks
In some of the previously configured projects, classifications and comments were not displayed correctly for already annotated chunks. This has been corrected.
In addition, validation and UI behavior have been strengthened through improved project configuration enforcement:
Required Field Validation
- If a classification or NER field is configured as required, the UI now correctly enforces it.
- Required annotations now properly validate associated required fields, such as comments.
Conditional / Dependent Fields
- Fields that depend on earlier selections are now enforced correctly.
- Follow-up fields become mandatory only when the preceding field is filled.
-
Pagination now visible for long tasks in Comparison and De-Identification views
Under certain conditions, pagination controls were not visible for longer tasks in the Comparison view and were inconsistently displayed in the De-Identification view. Pagination is now consistently rendered and functions correctly in both views.
-
Rating tooltips restored for configurations beyond 5 stars
When Rate PDF projects were configured with more than five stars, rating tooltips were not displayed as expected. This has been corrected. New Rate PDF projects now default to a five-star configuration, ensuring consistent tooltip behavior.
-
Deploy button no longer flickers after re-deploying the pre-annotation server
A visual flicker could occur on the deploy/pre-annotation button after re-deploying the pre-annotation server in NER projects. The button now remains visually stable and accurately reflects the current deployment state.
Annotation, Models & Pre-Annotation
-
Faster pre-annotation with combined NER models, rules, and prompts
Performance degradation was observed when running pre-annotation using a combination of NER models, rules, and prompts. Execution has been optimized and now processes tasks more efficiently.
-
Multi-line annotation behavior corrected
In certain scenarios, multi-line annotations did not behave as expected. Automatic clicks no longer expand existing annotations incorrectly, and multiple selections no longer result in inactive grey/red regions.
-
Full span highlighting restored in PDF projects
In PDF projects, annotations previously highlighted individual tokens rather than the full annotated span. Full spans are now highlighted correctly during annotation and review.
-
Pre-annotation server deployment fixed for checkbox and handwriting projects
Deployment failures could occur when starting pre-annotation servers for Checkbox Detection and Handwriting projects. Servers now deploy successfully and support pre-annotation as expected.
-
Task count now displayed on the Pre-Annotation button
The Pre-Annotation button did not consistently display the number of tasks being processed during execution. Task count information is now shown correctly.
-
Annotation no longer blocked in PDF+Text projects with “Label All Occurrences” enabled
When the “Label All Occurrences” option was enabled, annotation actions could be blocked in PDF+Text projects. Annotation now functions correctly with this option enabled.
PDF, OCR & Imports
-
PDF files can no longer be imported into Audio and Video projects
The system previously allowed PDF files to be imported into Audio and Video project types. The OCR import option has been removed for these project types, preventing incompatible imports.
-
Cloud-based PDF import fixed for text-based projects
Importing PDF files from cloud sources in text-based projects could result in an unexpected “Something went wrong” error. Cloud-based PDF files can now be imported into NER projects without errors.
-
Mixed PDFs (image + text) now supported in text-based projects
Mixed PDFs containing both image-based and text-based content could cause import failures in text-based projects. Mixed PDFs are now handled correctly.
-
Cloud credentials properly saved during PDF import
Cloud credentials provided during PDF import were not always saved or refreshed, resulting in outdated credentials being reused. Credentials are now saved and refreshed correctly.
-
OCR Server field now auto-refreshes on the Import page
The OCR Server field on the Import page did not automatically refresh when the server became ready. The Import page now updates automatically to reflect server readiness.
-
OCR document import restored for NER projects
OCR documents could not be imported into NER projects under certain conditions. Both local and cloud imports now work as expected.
Analytics, Integrations & System Stability
-
Annotator comparison chart fixed in Visual NER projects
The annotator comparison chart did not consistently load or render data correctly in Visual NER projects. This has been resolved.
-
Blind evaluation completions can no longer be edited without creating a new completion
Submitted completions in Blind Evaluation projects could be edited using keyboard shortcuts without creating a new completion. A new completion is now required before edits can be made.
-
Concurrent imports prevented during active import operations
Refreshing the page during an active import could allow additional imports to be initiated concurrently. Import actions now remain disabled until the current process completes.
-
Chart update errors eliminated from system logs
During Analytics Dashboard refresh operations, “Couldn’t update chart” messages were observed in the pod logs. Chart data now updates correctly without generating errors.
-
LLM responses now generated correctly with special characters in response names
LLM responses failed to generate when response names contained supported special characters. This limitation has been removed.
-
Deletion of integrated external service providers now properly restricted
Integrated external service providers could previously be deleted without sufficient validation. Deletion behavior has been restricted to prevent unintended configuration loss.
-
Synthetic task generation fixed for integrated LLM providers
Synthetic task generation could fail when using integrated LLM providers. Synthetic tasks are now generated reliably across supported providers.
-
Stale “Cannot Delete Provider” message no longer persists on the Integration page
The “Cannot Delete Provider” message could persist on the Integration page even when no deletion error was present. This message is no longer displayed incorrectly.
-
License validation no longer triggered after open-source training
License-related errors appeared in training server logs after open-source model training completed. License validation is no longer triggered for open-source training workflows.
-
OIDC/SAML login restored after system restore
After system restore, OIDC/SAML authentication could redirect users to profile update flows instead of completing login. Users are now logged in correctly after restore.
-
Cluster logs accessible without errors
Accessing cluster logs could result in internal server errors under certain conditions. Cluster logs are now accessible reliably.
Versions
- 8.2.1
- 8.2.0
- 8.1.3
- 8.1.2
- 8.1.1
- 8.1.0
- 8.0.1
- 8.0.0
- 7.8.2
- 7.8.1
- 7.8
- 7.7
- 7.6.0
- 7.5.1
- 7.5.0
- 7.4.0
- 7.3.1
- 7.3.0
- 7.2.2
- 7.2.1
- 7.2.0
- 7.1.0
- 7.0.1
- 7.0.0
- 6.11.3
- 6.11.2
- 6.11.1
- 6.11.0
- 6.10.1
- 6.10.0
- 6.9.1
- 6.9.0
- 6.8.1
- 6.8.0
- 6.7.2
- 6.7.0
- 6.6.0
- 6.5.1
- 6.5.0
- 6.4.1
- 6.4.0
- 6.3.2
- 6.3.0
- 6.2.1
- 6.2.0
- 6.1.2
- 6.1.1
- 6.1.0
- 6.0.2
- 6.0.0
- 5.9.3
- 5.9.2
- 5.9.1
- 5.9.0
- 5.8.1
- 5.8.0
- 5.7.1
- 5.7.0
- 5.6.2
- 5.6.1
- 5.6.0
- 5.5.3
- 5.5.2
- 5.5.1
- 5.5.0
- 5.4.1
- 5.3.2
- 5.2.3
- 5.2.2
- 5.1.1
- 5.1.0