Overview
Organizations working in regulated environments -particularly healthcare -need a reliable way to track who did what, when, and where across their annotation platform. The Audit Logs Dashboard, introduced in version 7.8, brings HIPAA-compliant, system-wide auditing to Generative AI Lab. It provides centralized visibility into platform activity across all projects and users, helping teams meet compliance requirements while maintaining full accountability.
The dashboard can be accessed from the Audit Dashboards menu in the left sidebar, available to users with the appropriate administrative privileges.
What Gets Logged
The Audit Logs Dashboard captures a broad range of system events to give administrators a complete picture of platform activity. Every logged event is recorded with a timestamp and associated user information, ensuring full traceability. The types of events tracked include:
- User actions -Any operation performed by a user across projects, such as creating, editing, or submitting annotations.
- Data access and modifications -Records of when data is viewed, updated, or deleted, providing an audit trail for sensitive content.
- Data exports -Tracking of all export operations, including the project, user, and export type (e.g., local).
- Project lifecycle events -Creation and deletion of projects, including who performed the action and when.
- API usage and response codes -System-level logging of API calls, HTTP status codes, and request volumes, useful for identifying unusual patterns or troubleshooting issues.
Dashboards and Visualizations
Audit data is presented through a set of built-in dashboards, each designed to surface a different aspect of platform activity. Rather than sifting through raw logs, users can navigate purpose-built views that organize events into meaningful categories.
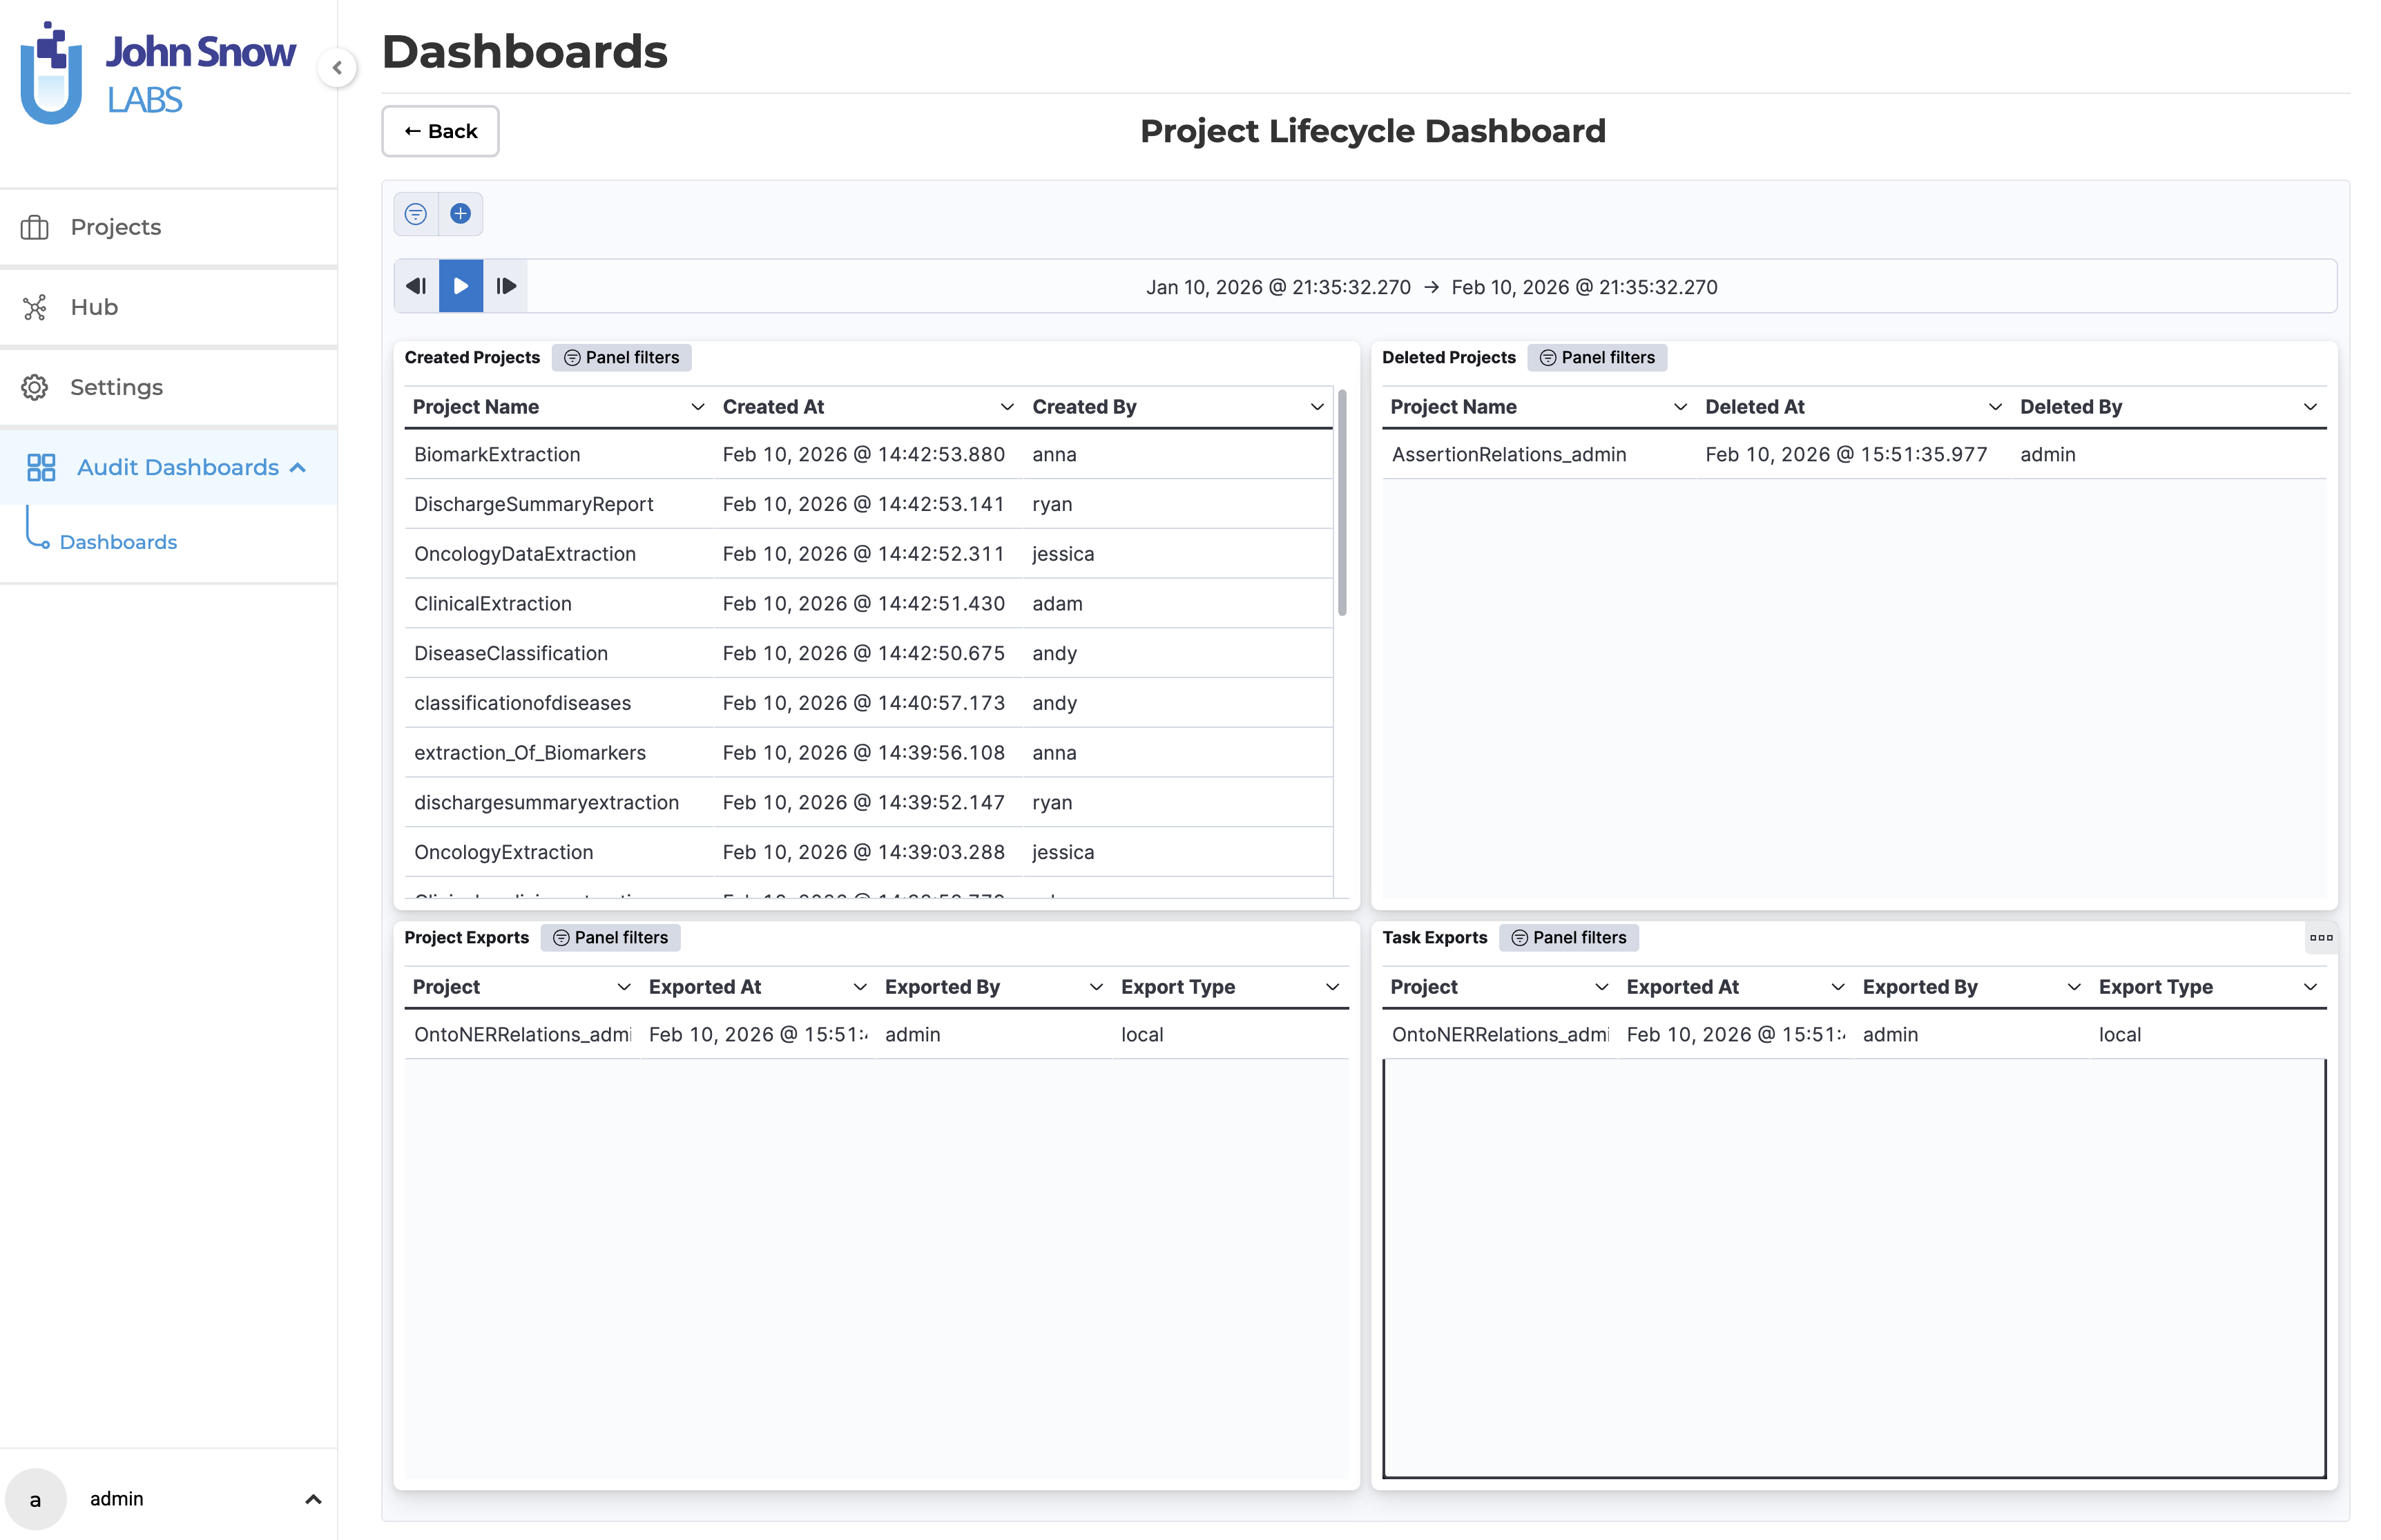
Project Lifecycle Dashboard
The Project Lifecycle Dashboard gives a consolidated view of project-level activity. It displays four panels: Created Projects, Deleted Projects, Project Exports, and Task Exports. Each panel lists the relevant events with details such as the project name, timestamp, the user who performed the action, and, for exports, the export type. This view is especially useful for tracking how projects evolve over time and for auditing data export activity.
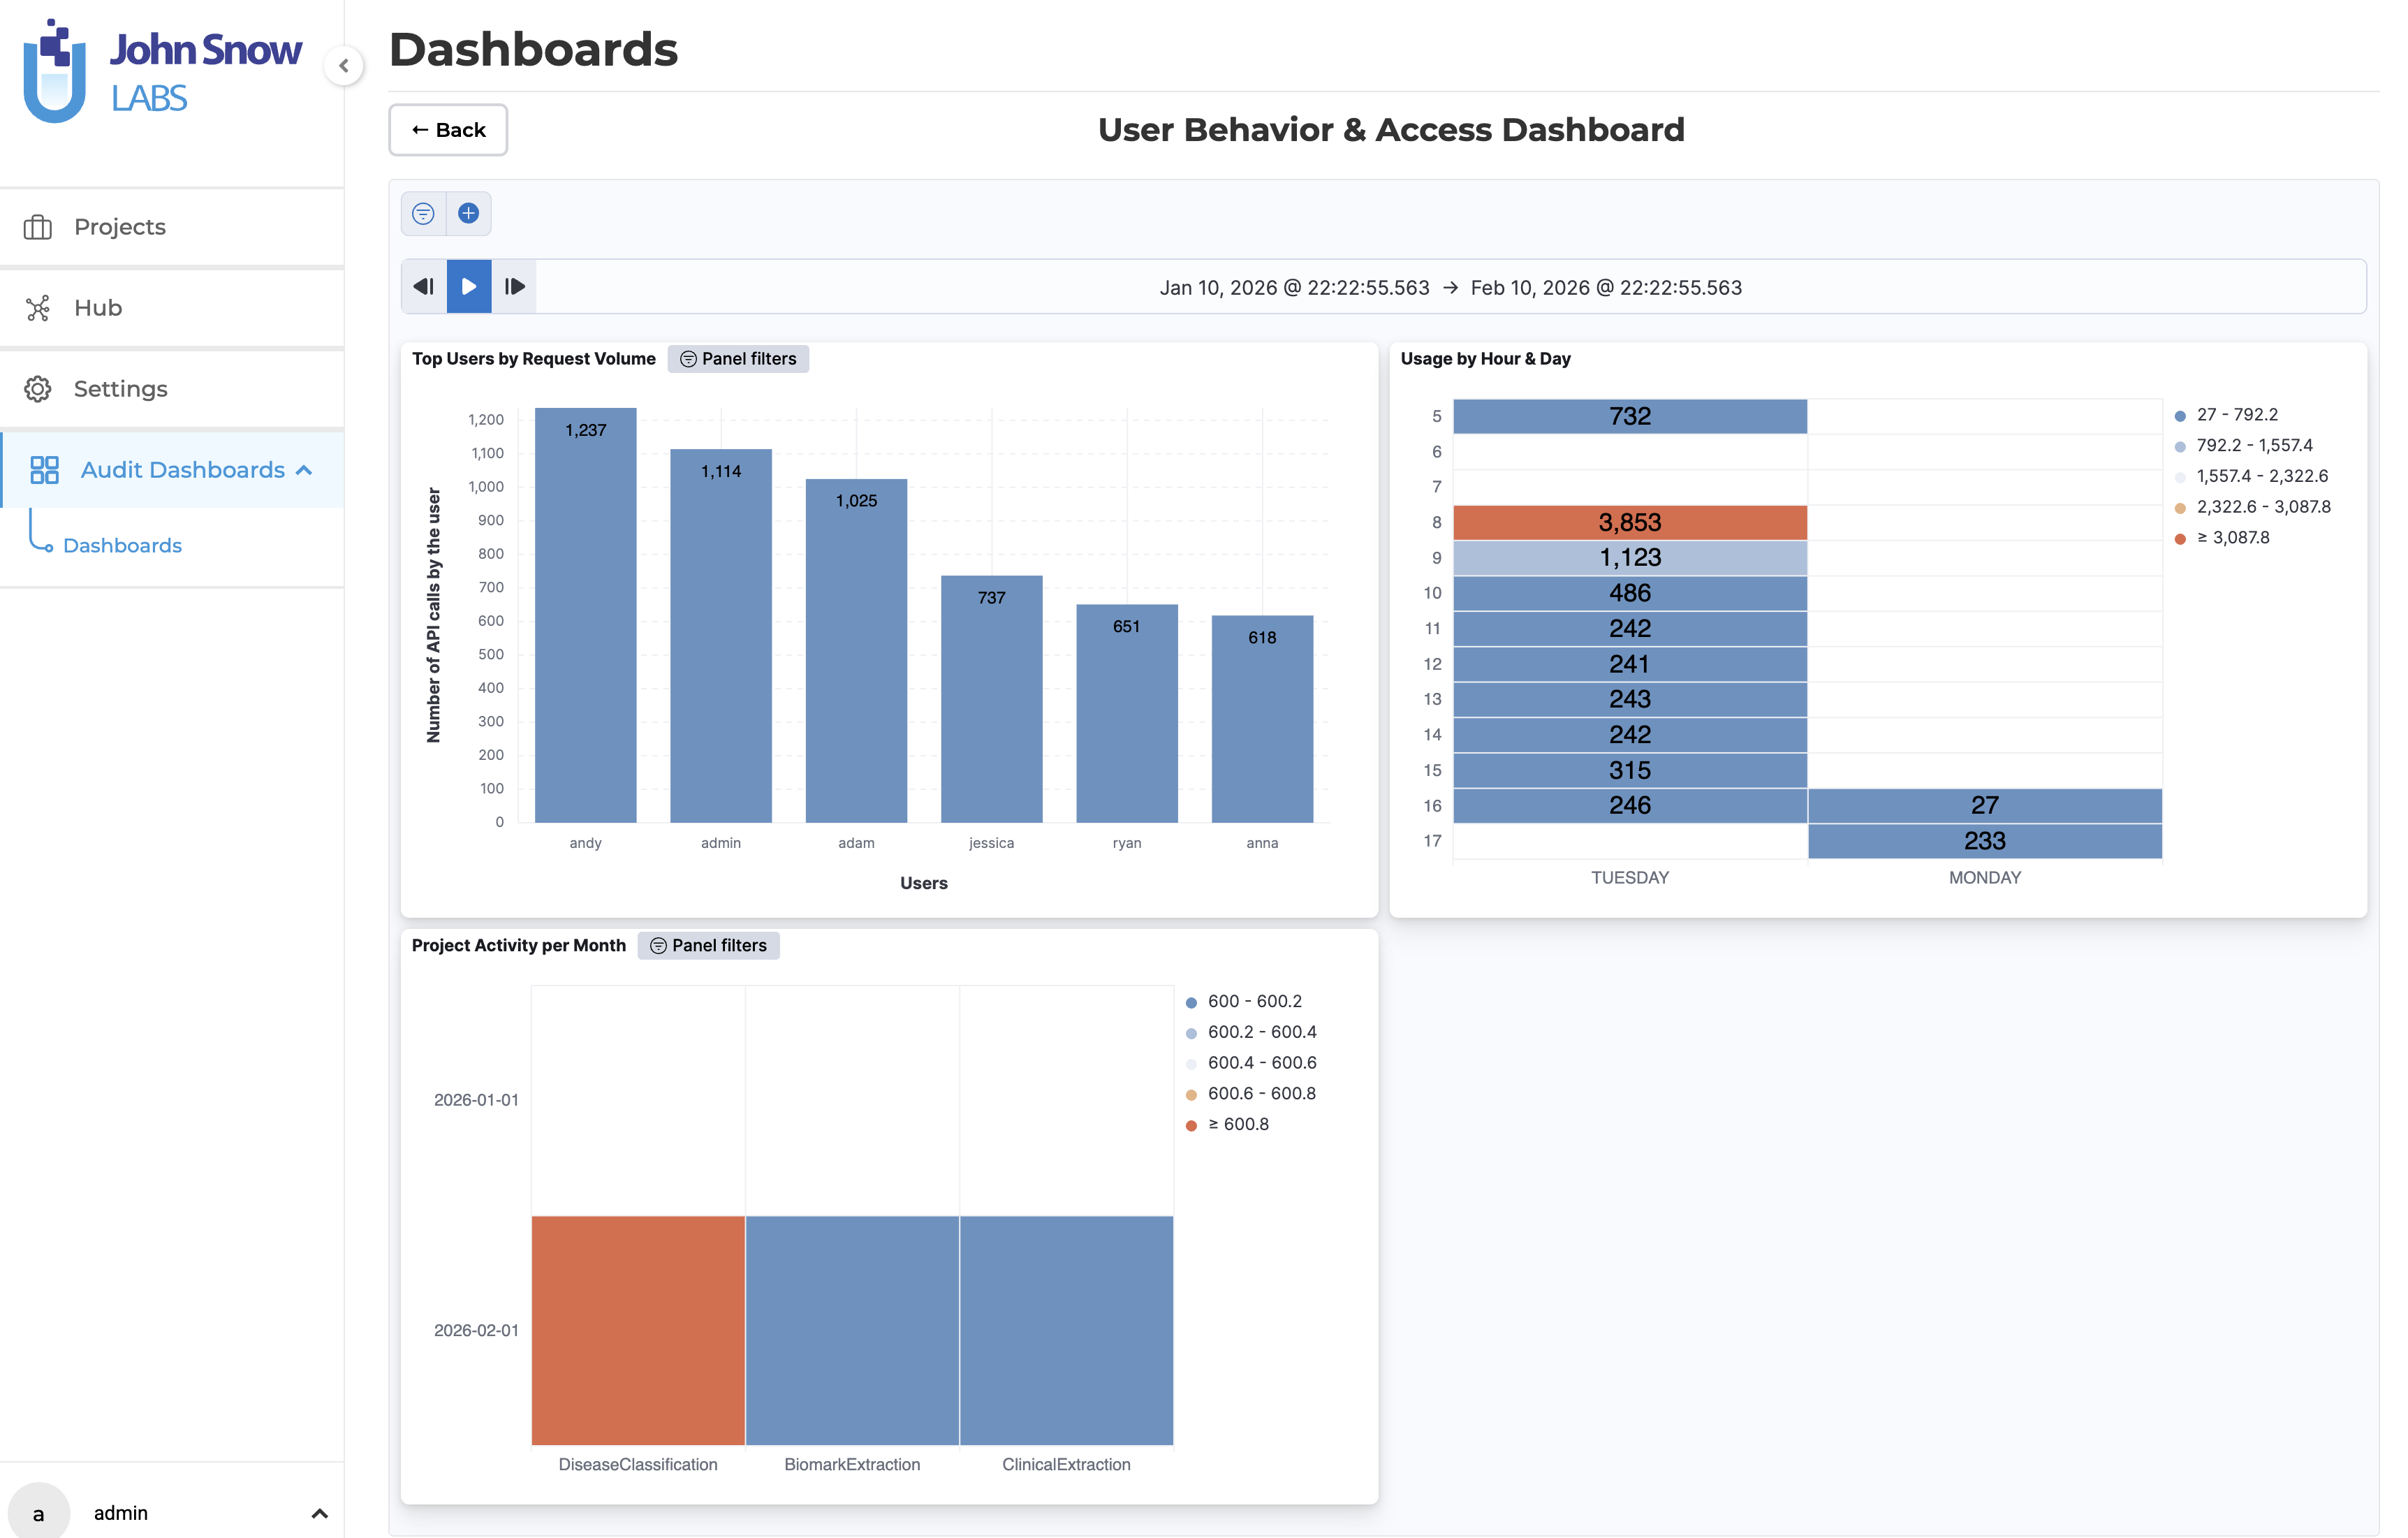
User Behavior & Access Dashboard
The User Behavior & Access Dashboard focuses on who is using the platform and how. It includes a Top Users by Request Volume chart that ranks users by their API activity, a Usage by Hour & Day heatmap that reveals when the platform is most active, and a Project Activity per Month breakdown that shows activity trends across individual projects over time. Together, these visualizations help administrators identify usage patterns, spot anomalies, and support capacity planning.
Filtering and Custom Views
All dashboards support flexible filtering to help users zero in on the events that matter most. Audit data can be filtered by:
- Project -Focus on activity within a specific project.
- User -Investigate actions performed by a particular user.
- Event type -Isolate specific operations such as deletions or exports.
- Date range -Narrow the view to a specific time window for targeted investigations.
Each dashboard panel includes a Panel filters control that allows users to apply filters directly within that view, making it straightforward to create targeted audit reports without leaving the dashboard.
Enabling Audit Logging
Audit logging is not enabled by default. It can be turned on globally during installation or upgrade using a dedicated installer flag. When enabled, the required backend services -including Elasticsearch -are automatically provisioned if not already present.
During installation:
./annotationlab-installer.sh --enable-audit-logs
During upgrade:
./annotationlab-updater.sh --enable-audit-logs
Enabling audit logging during an upgrade does not affect existing data or configurations.
Data Retention
Audit log retention is configurable, allowing organizations to define how long event data is stored. This makes it possible to align retention periods with internal data governance policies and regulatory requirements such as HIPAA.