Native DICOM Image Support and Intelligent Data Import in Generative AI Lab 8.2
Generative AI Lab 8.2 introduces major enhancements for healthcare AI workflows, medical imaging, and annotation efficiency. The headline feature is native DICOM image support, enabling organizations to import, annotate, review, and de-identify medical images directly within the platform while preserving associated metadata and protecting sensitive patient information.
This release also introduces intelligent JSON label mapping, making it easier to import annotation datasets created in other projects or external tools. Labels are automatically matched to the target project, significantly reducing manual configuration and simplifying the reuse of pre-annotated data.
In addition, Generative AI Lab 8.2 delivers a range of usability and workflow improvements across annotation and review experiences, including enhanced relation navigation and sorting, more precise Test Suite controls, configurable text trimming options, and backend optimizations that improve terminology resolver performance and stability during large-scale pre-annotation workflows.
Native DICOM Image Support: Annotation and De-Identification for Medical Images
What’s New
Generative AI Lab now provides native support for DICOM (Digital Imaging and Communications in Medicine), allowing healthcare organizations to upload, annotate, review, compare, and de-identify medical images directly within the platform. Users no longer need to convert DICOM studies into JPEG or PNG before annotation, preserving image quality, clinical metadata, and existing annotation workflows.
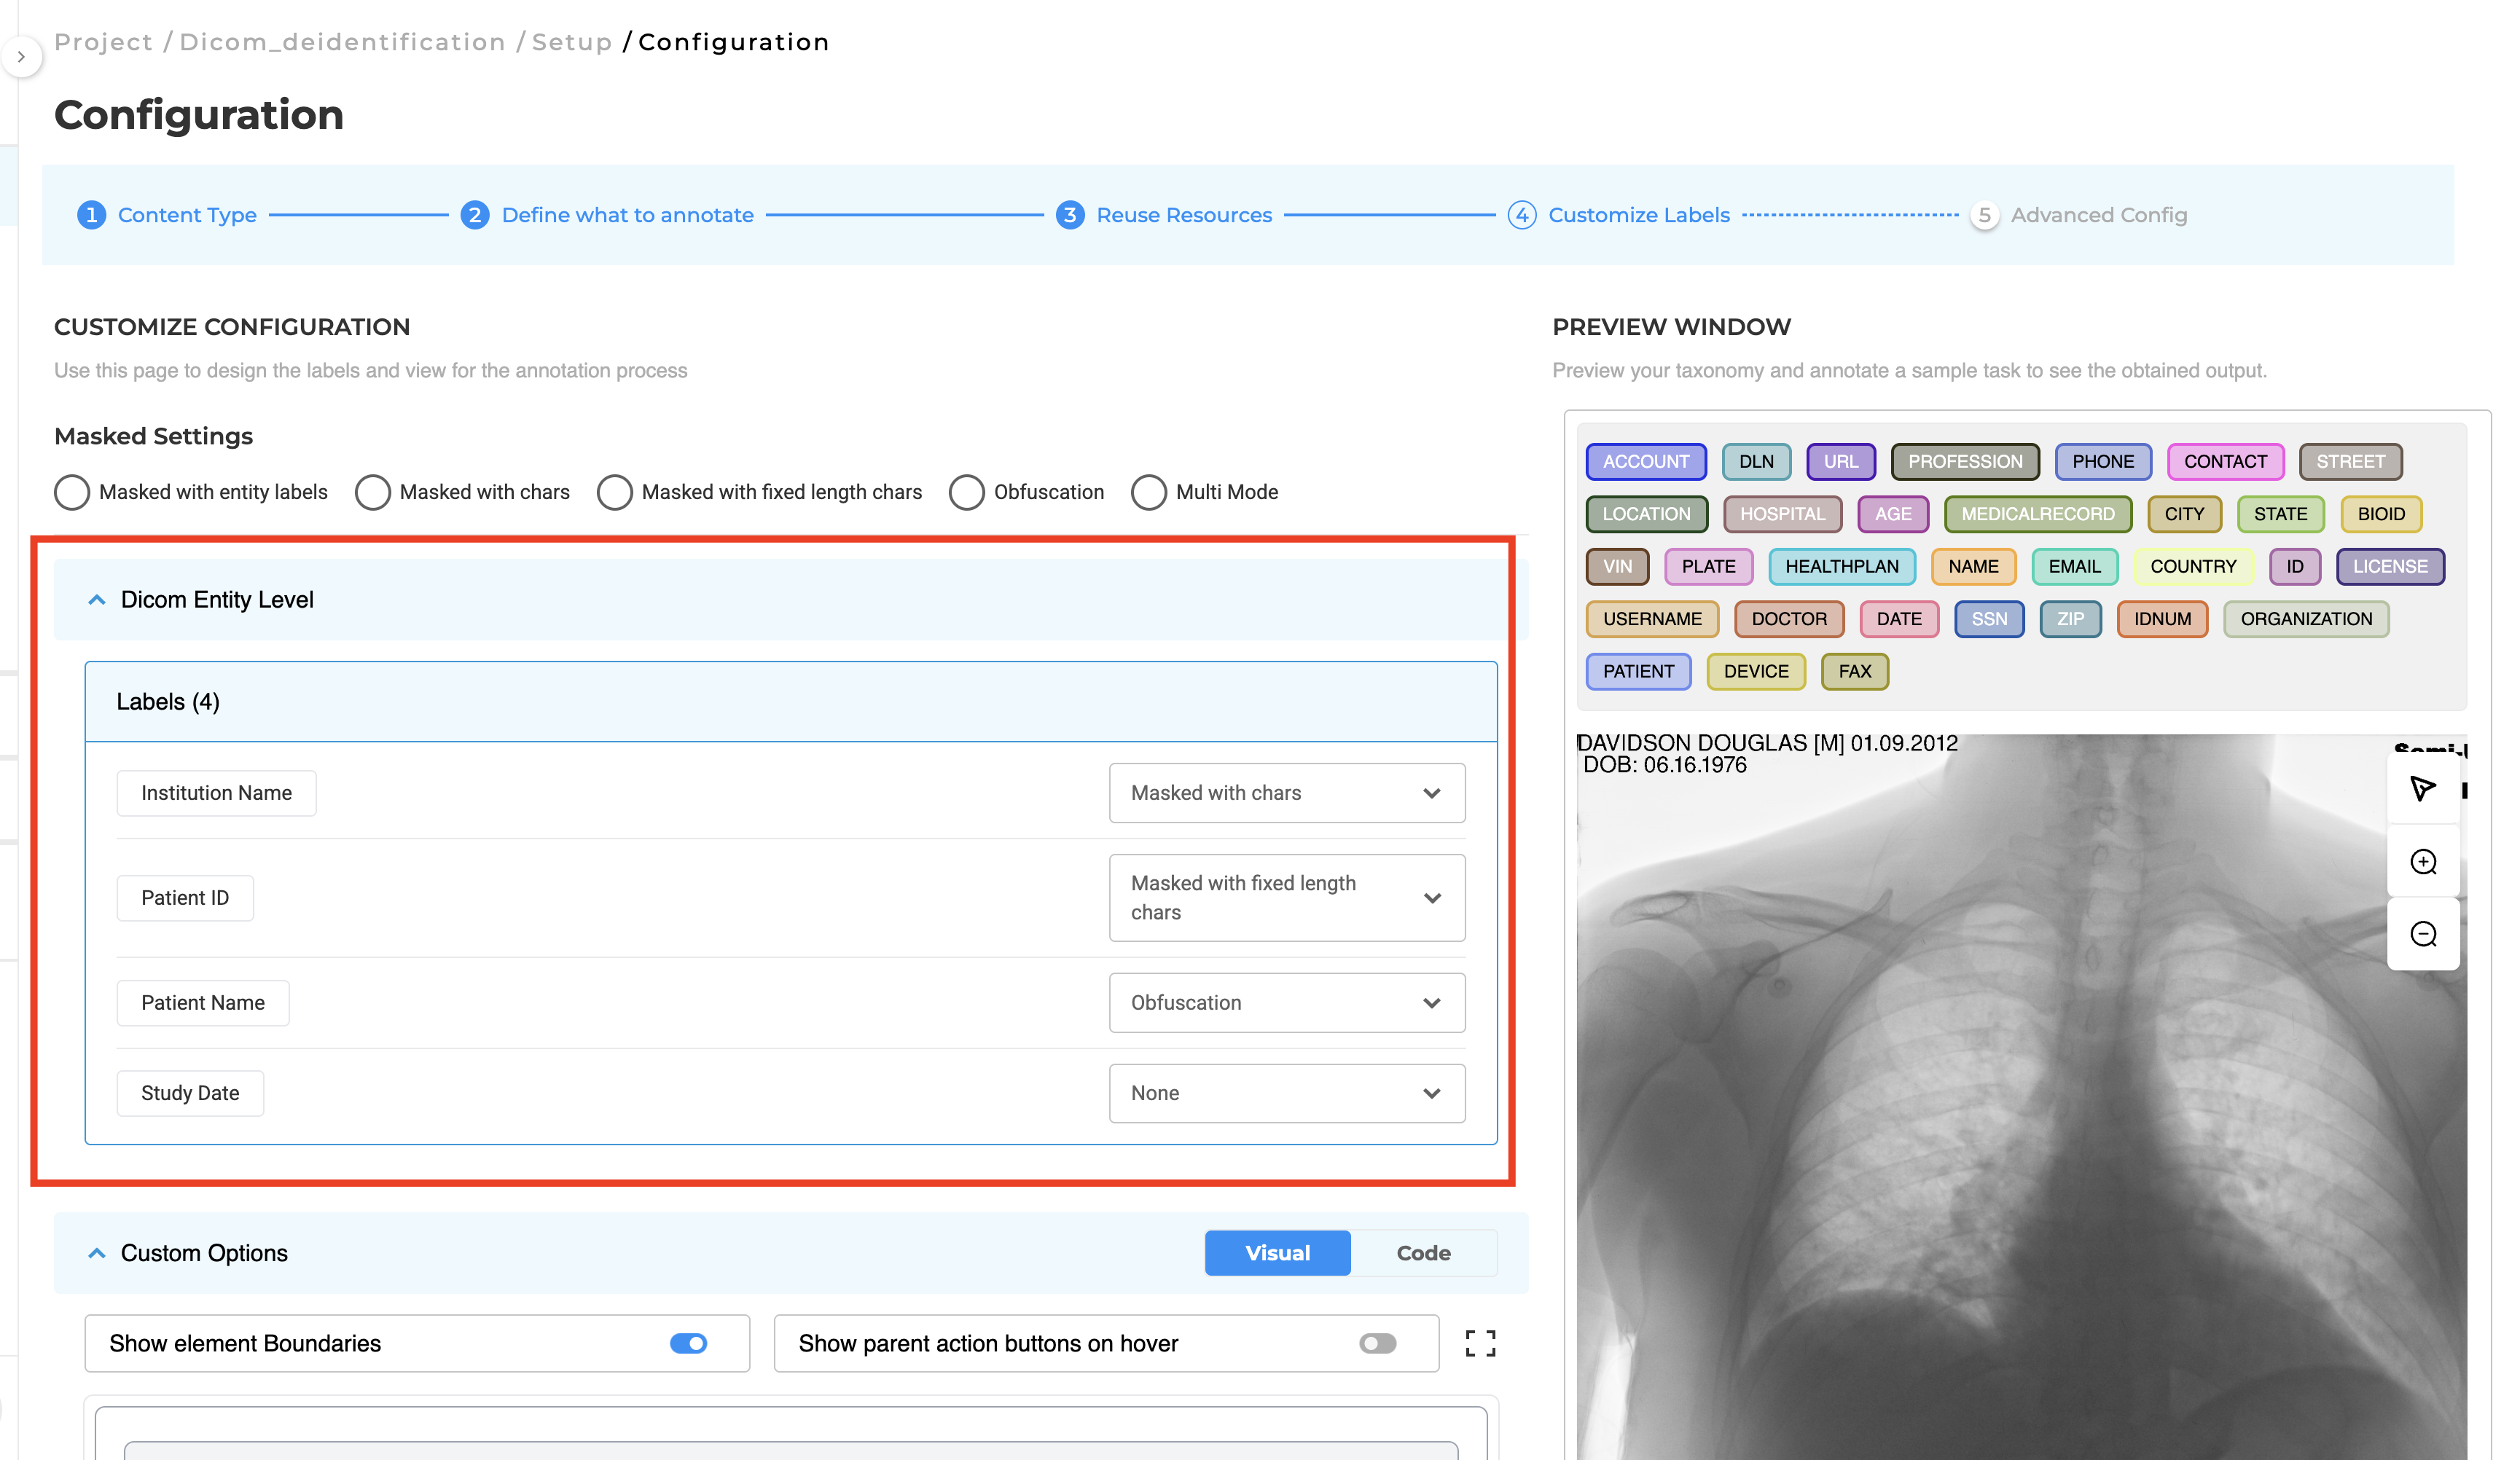
This release also introduces dedicated DICOM De-Identification projects, enabling users to de-identify both image content and supported DICOM metadata using configurable masking rules. Original and de-identified images can be reviewed side by side together with metadata changes, making it easier to validate de-identification results before exporting.
Supported metadata fields for masking: Institution Name, Patient ID, Patient Name, and Study Date.
Technical Details
-
Native DICOM Support
Upload .dcm files directly through the user interface or supported APIs without requiring external conversion tools.
-
Automatic Medical Image Rendering
DICOM images are rendered automatically within the annotation workspace while preserving their original image quality.
-
Annotation Compatibility
Existing image annotation tools and workflows are fully supported within DICOM projects, allowing teams to use familiar annotation capabilities without modification.
-
Metadata Preservation
Supported DICOM metadata is retained throughout the workflow and processed according to the configured de-identification settings.
-
Metadata Comparison
The DICOM comparison view supports both Image Comparison and Metadata Comparison, enabling reviewers to validate image modifications alongside metadata changes before exporting.
-
Configurable Metadata Masking
DICOM De-Identification projects include a dedicated Metadata Masking Settings section where masking behavior can be configured independently for each supported metadata field.
Supported masking methods include:
- Masked with Characters
- Masked with Fixed-Length Characters
- Obfuscation
- None
Note: Selecting None removes the value from the corresponding metadata field in the de-identified DICOM file.
User Benefits
-
End-to-End Medical Imaging Workflows — Upload, annotate, compare, and de-identify DICOM images without external conversion.
-
Comprehensive De-Identification — Protect both image content and supported DICOM metadata using configurable masking methods.
-
Improved Validation — Compare original and de-identified images together with metadata changes before exporting.
-
Preserved Clinical Quality — Maintain original image quality while applying configurable metadata de-identification.
-
Reduced Operational Overhead — Eliminate third-party conversion tools and simplify medical imaging workflows within a single platform.
Example Use Case
A hospital imaging team imports MRI and CT studies directly into a DICOM De-Identification project. After configuring metadata masking rules, reviewers compare the original and de-identified images alongside metadata changes to verify that patient information has been removed while preserving the clinical quality required for research and AI model development.
Flexible Label Matching & Mapping for JSON Uploads
What’s New
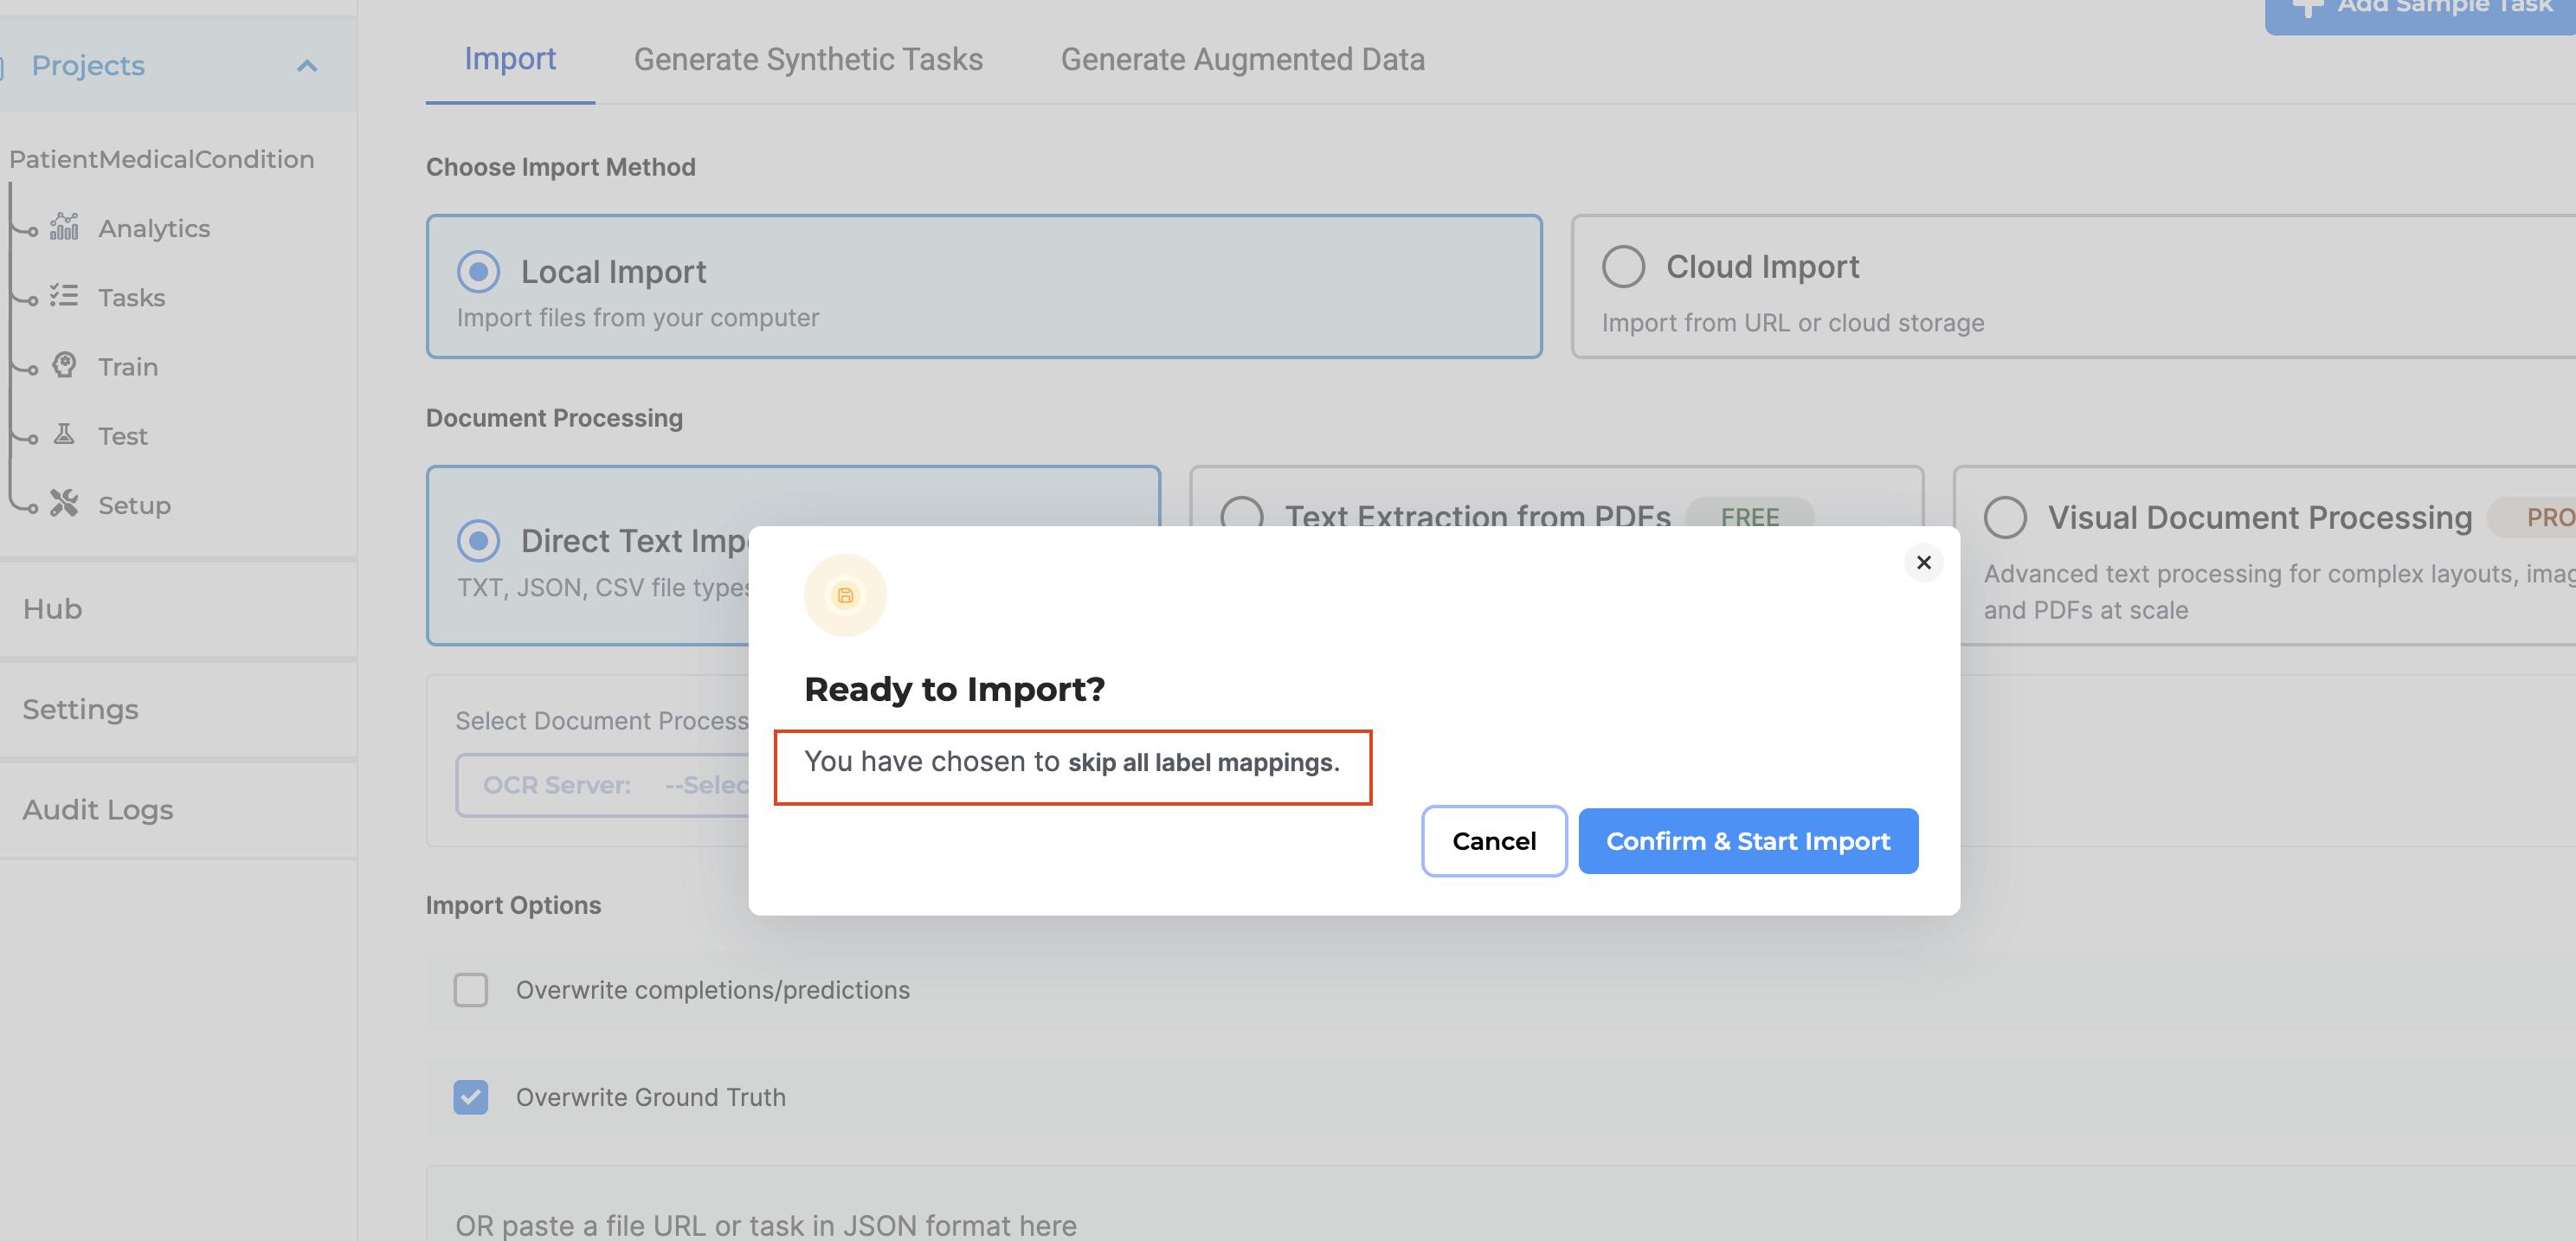
Generative AI Lab now introduces Flexible Label Matching & Mapping, making it easier to reuse annotation datasets across projects without modifying the original JSON files.
Previously, importing pre-annotated tasks or previously exported annotations required every label name in the uploaded JSON to exactly match the labels configured within the destination project. Even minor differences in capitalization or naming conventions prevented the import and required users to manually edit their datasets.
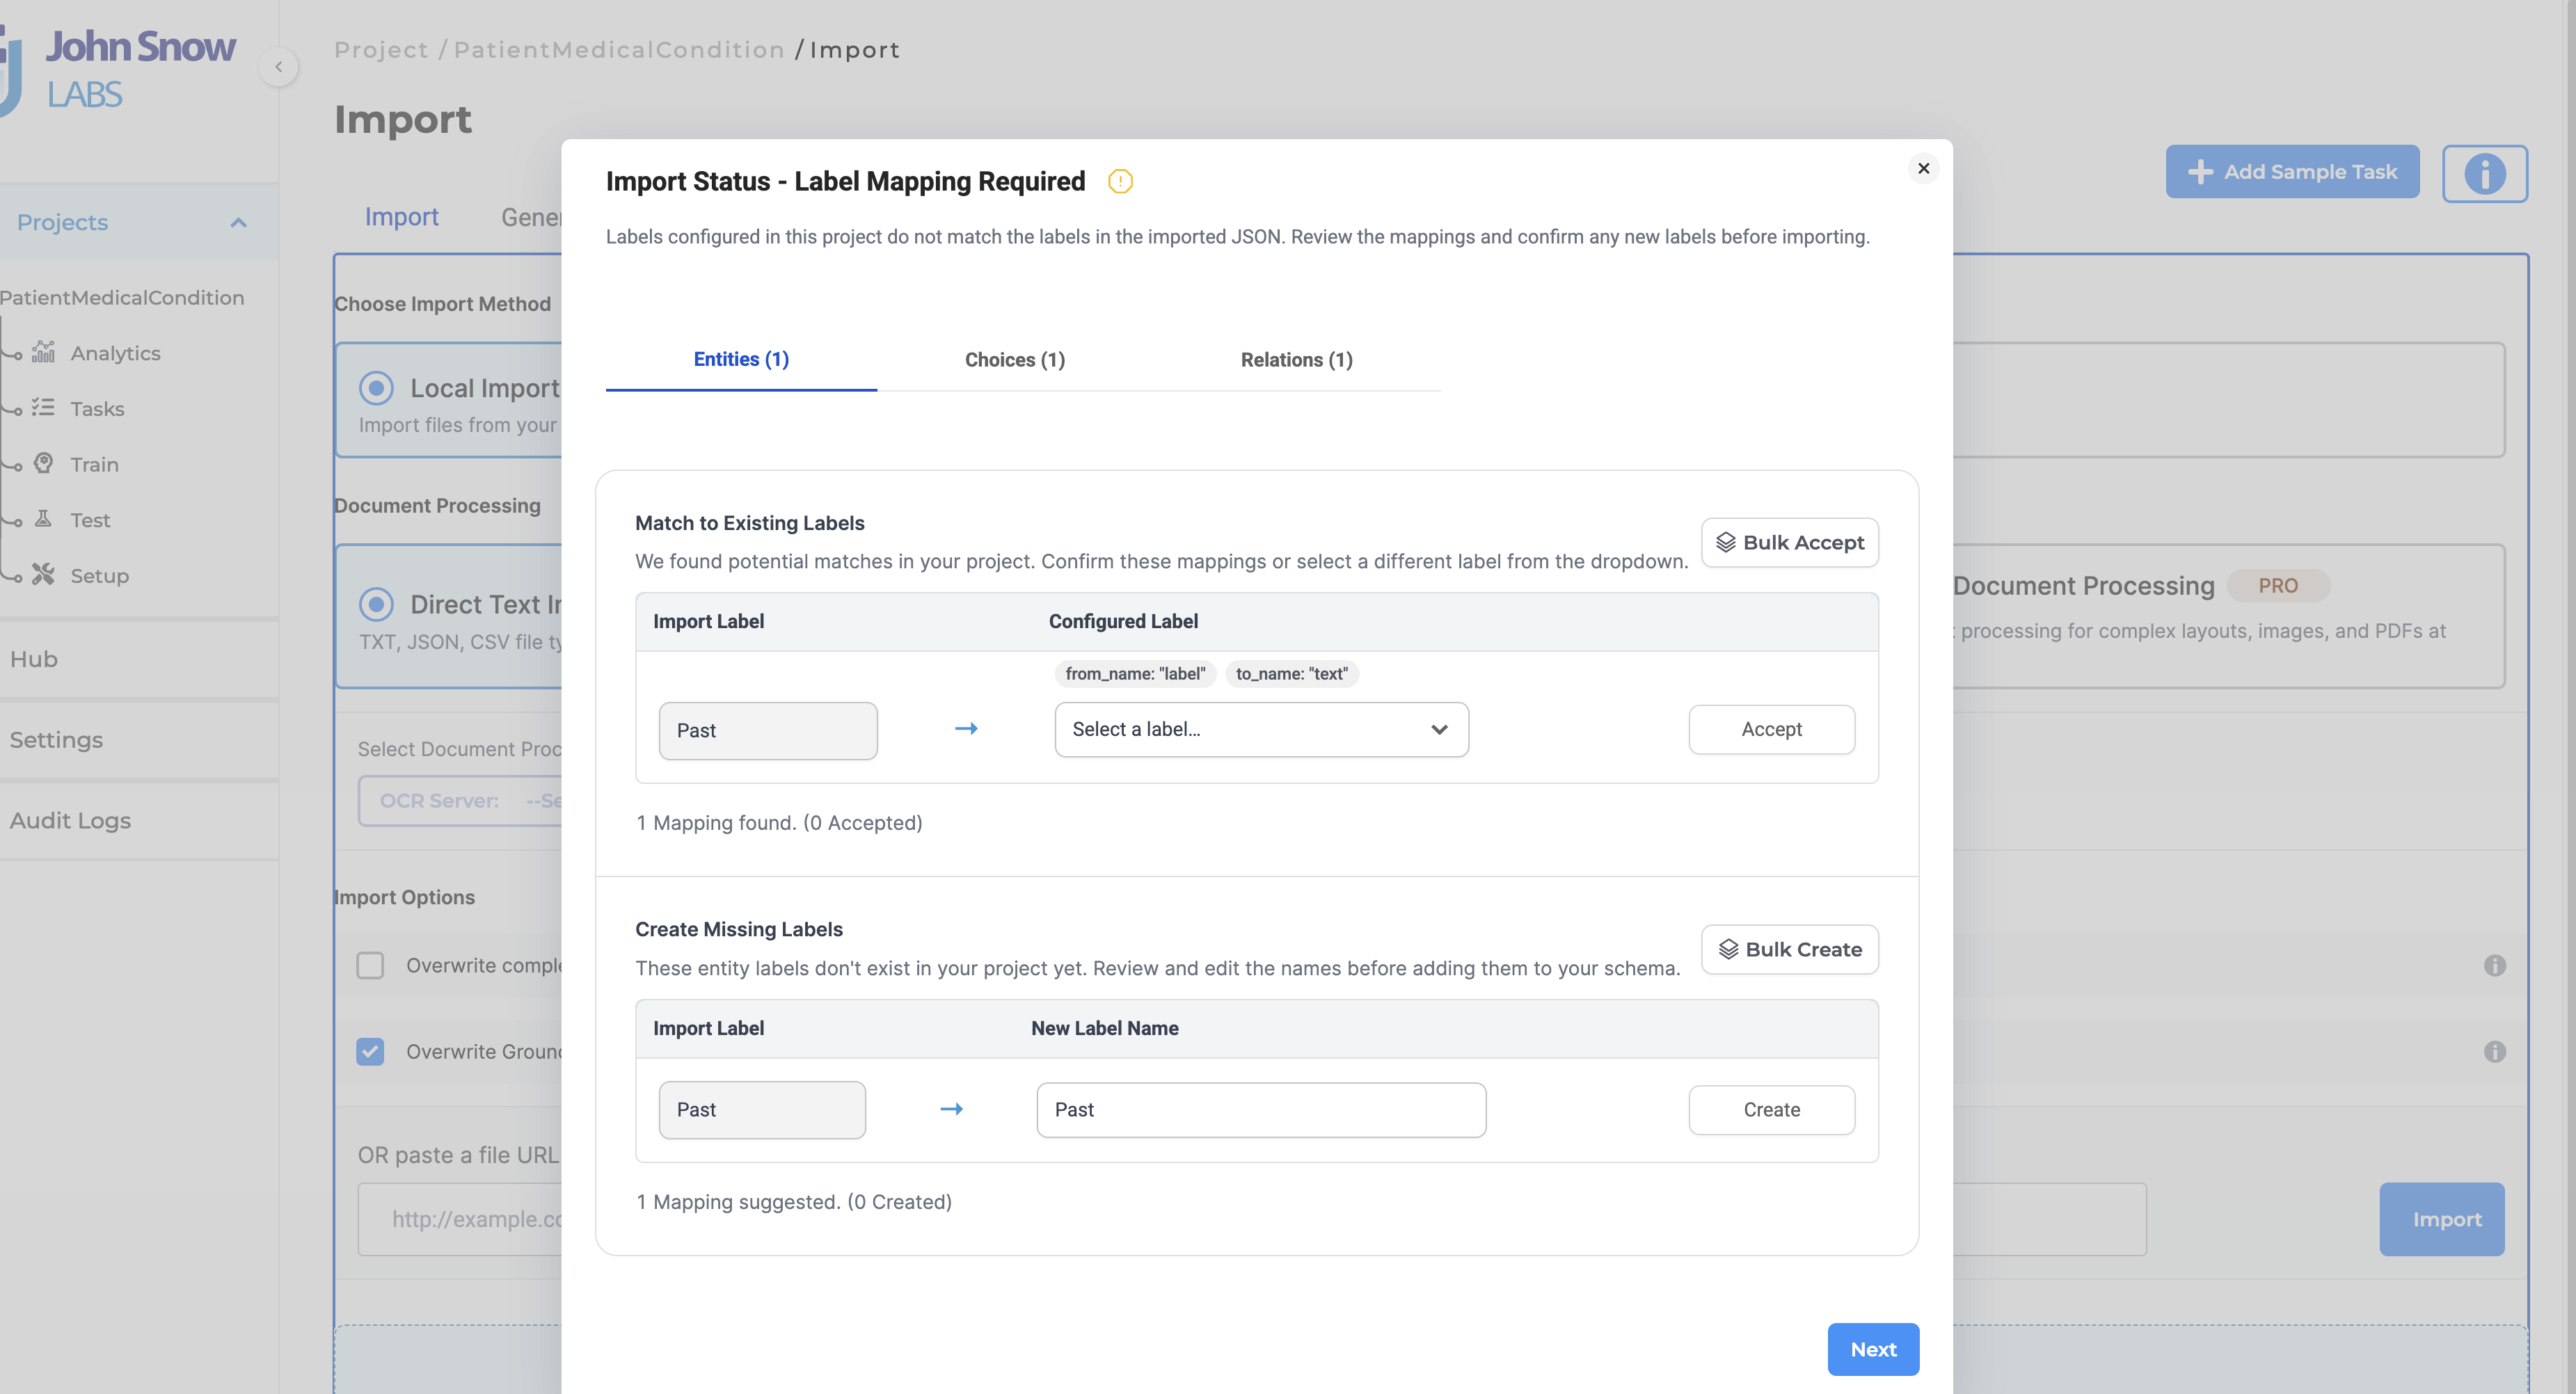
With Flexible Label Matching & Mapping, the platform automatically detects label discrepancies during import, suggests appropriate mappings, and allows users to review, approve, or customize mappings before the upload is completed. This significantly reduces manual preparation while ensuring imported annotations remain consistent with the destination project’s label configuration.
Technical Details
Automatic Label Detection
During JSON import, Generative AI Lab automatically compares labels contained in the uploaded file with the labels configured for the selected project.
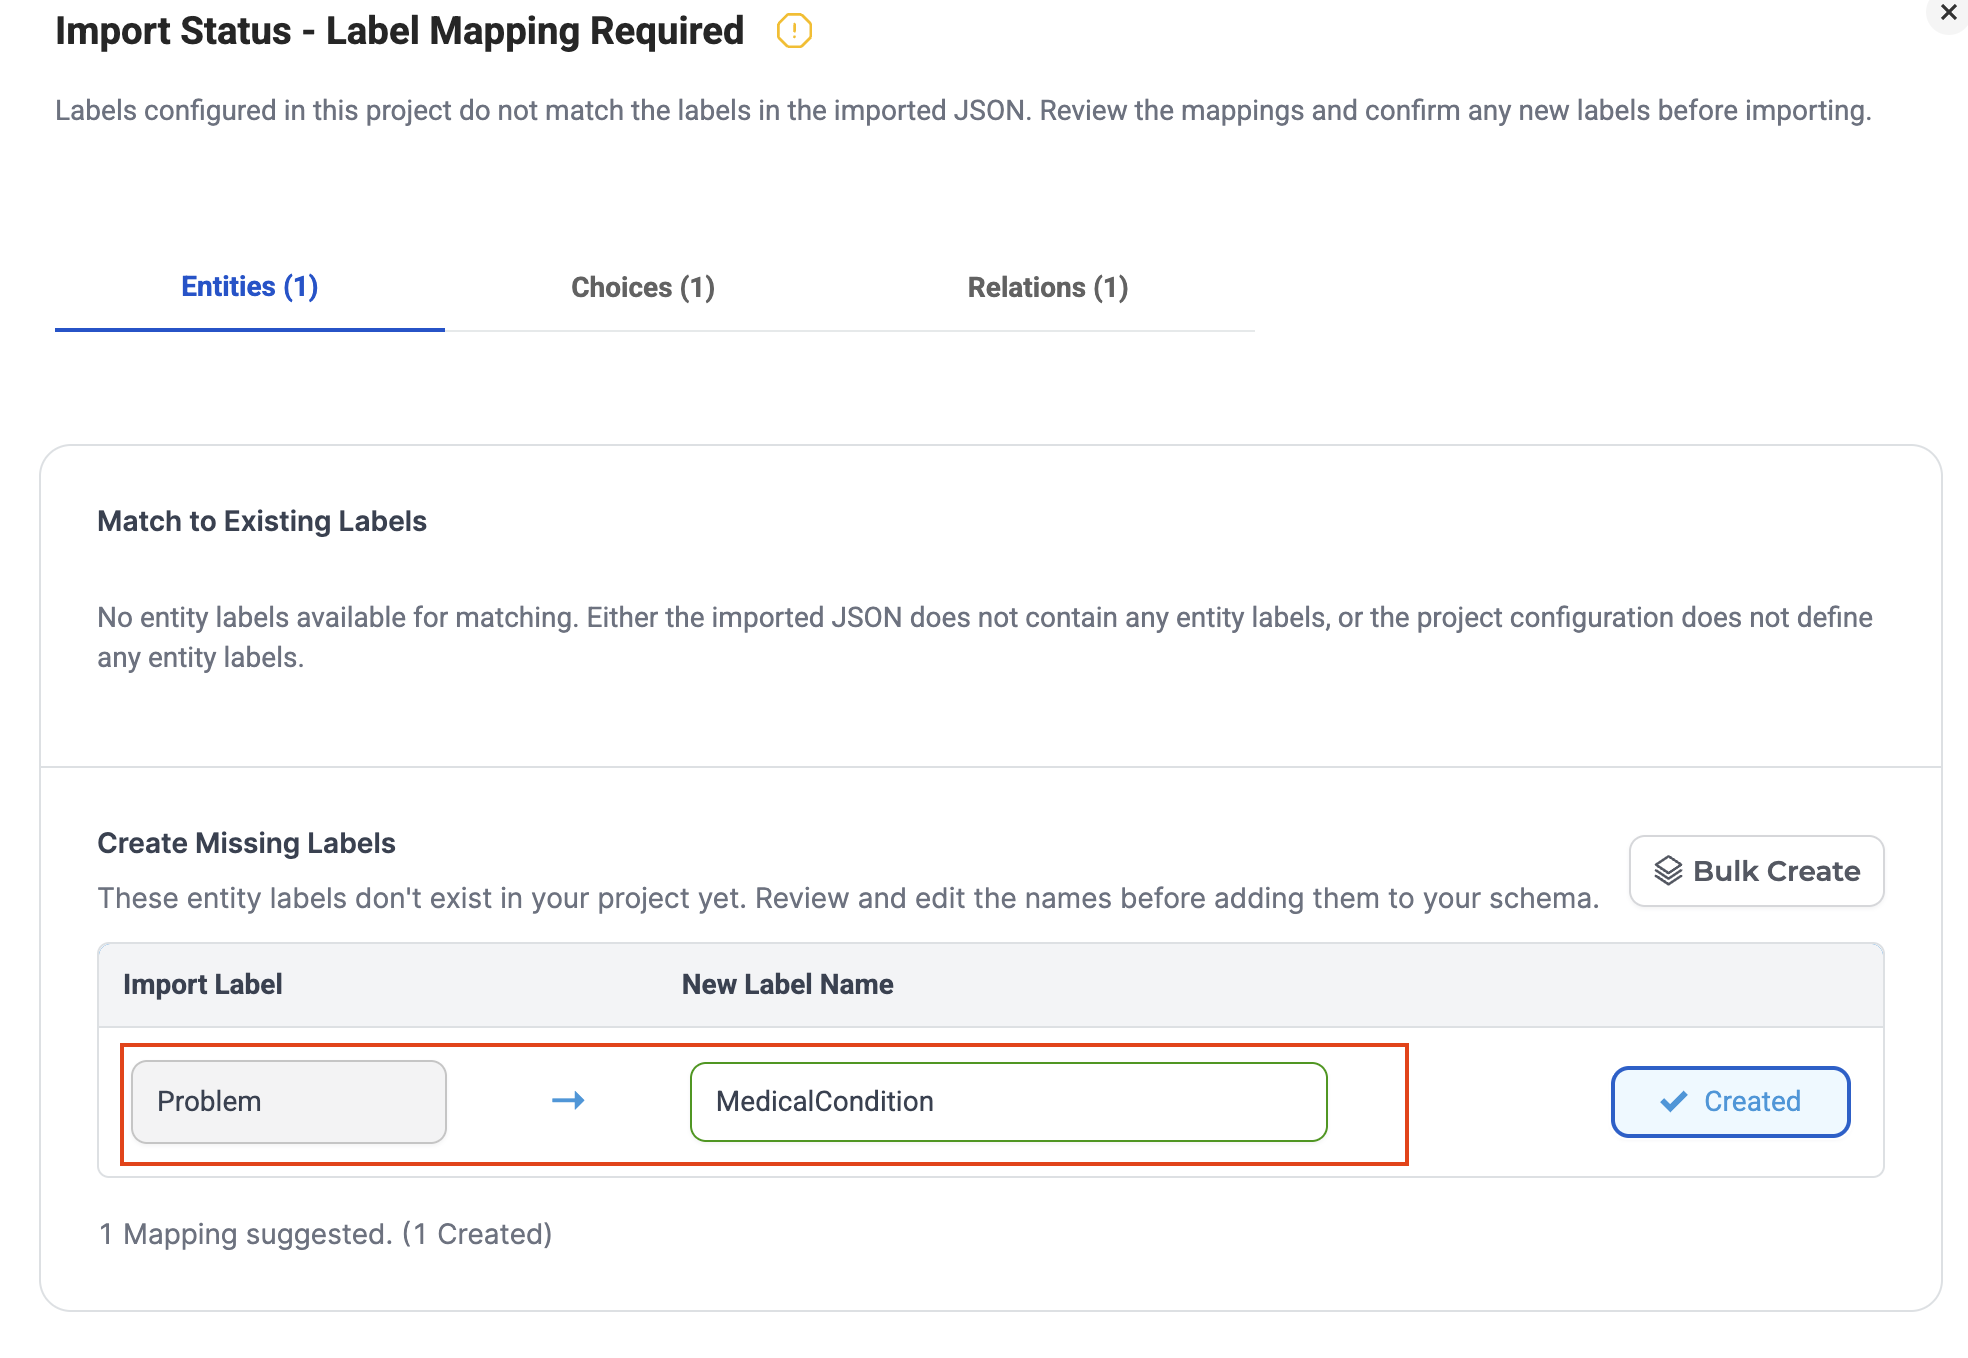
Instead of rejecting the upload when differences are detected, the platform identifies unmatched labels and presents them for review.
Intelligent Label Matching
To reduce manual effort, the system automatically suggests mappings for labels that closely resemble existing project labels using:
- Case-insensitive matching
- Normalized label comparison
- String similarity detection
For example:
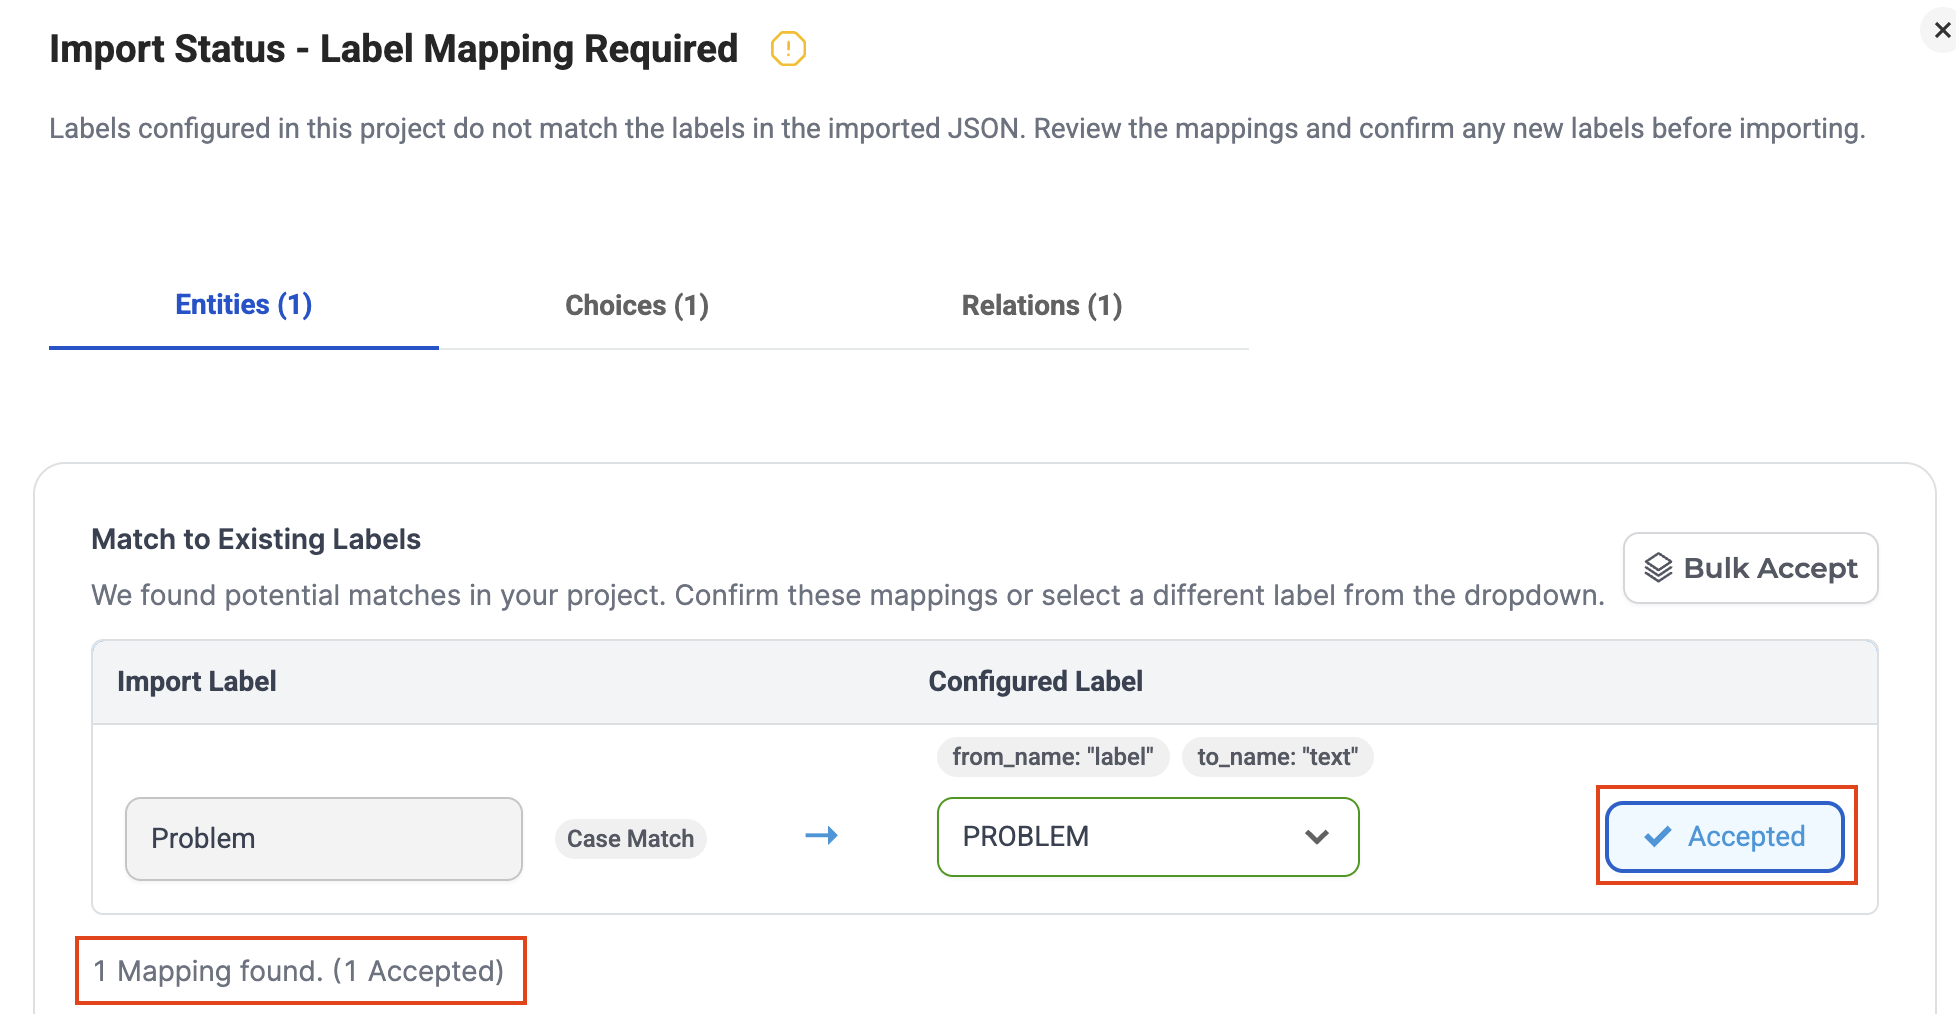
Problem to the existing project label PROBLEM.
These suggestions resolve common naming inconsistencies without requiring users to modify the original JSON dataset.
Interactive Mapping Interface
When unmatched labels are detected, a dedicated mapping interface allows users to:
- Review detected label mismatches
- Accept automatically suggested mappings
- Map labels to any existing project label
- Ignore labels that should not be imported
This ensures users remain in full control over how imported annotations are interpreted.
Automatic Mapping During Import
Once mappings have been confirmed, Generative AI Lab automatically applies them throughout the import process.
The uploaded JSON file remains unchanged while imported annotations are aligned with the destination project’s configured labels.
Broad Annotation Support
Flexible Label Matching & Mapping is supported across:
- Named Entity Recognition (NER)
- Classification
- Relation annotations
The feature is available for both Text NER and Visual NER projects, providing a consistent import experience across annotation workflows.
Validation & Error Handling
Imports proceed successfully once all label discrepancies have been resolved through approved mappings.
If unmatched labels remain unresolved, the platform presents clear validation messages identifying the remaining labels that require user attention.
User Benefits
-
Reuse Existing Annotation Datasets — Import pre-annotated tasks and previously exported annotations without modifying the original JSON files.
-
Reduced Manual Preparation — Automatically resolve common label naming differences through intelligent mapping suggestions.
-
Improved Import Success — Prevent unnecessary import failures caused by capitalization differences or minor naming inconsistencies.
-
Greater User Control — Review, approve, or customize every detected label mapping before importing data.
-
Consistent Workflows Across Projects — Apply the same import experience across Text NER and Visual NER projects supporting NER, Classification, and Relation annotations.
Example Use Case
A healthcare annotation team wants to reuse a collection of pre-annotated clinical documents created for an earlier project. During import, Generative AI Lab detects that the uploaded dataset contains the label diagnosis, while the destination project uses Diagnosis.
Instead of rejecting the upload, the platform automatically suggests the appropriate mapping. After reviewing and confirming the suggested mappings, the team imports the dataset without modifying either the original JSON files or the destination project’s label configuration, allowing previously annotated data to be reused with minimal effort.
Improvements
Relation List Sorting for Improved Review Workflow
What’s Improved
The Relations panel now supports multiple sorting options, making it easier to review and navigate annotation tasks containing large numbers of relations. Previously, relations were displayed only in the order they were created, requiring reviewers to manually search through long relation lists during validation.
Users can now sort relations by Creation Order, Alphabetical Order, or Entity Type, with the selected sorting preference preserved throughout the review session. This enhancement is available in both NER and Visual NER projects, providing a more efficient and consistent review experience.
Technical Details
-
Multiple Sorting Options
The Relations panel now supports three sorting methods:
- Creation Order
- Alphabetical Order
- Entity Type (grouped by the first entity’s label)
-
Persistent Sorting Preference
The selected sorting option is retained throughout the review session, eliminating the need to repeatedly reapply the preferred view.
-
Support Across Project Types
Relation sorting is available in both NER and Visual NER projects, providing a consistent experience across annotation workflows.
User Benefits
-
Faster Navigation — Locate specific relations more quickly using the most appropriate sorting method.
-
Improved Review Efficiency — Group related entities together to simplify validation and reduce time spent searching through large relation lists.
-
Consistent Review Experience — Preserve sorting preferences throughout the review session for uninterrupted navigation.
Example Use Case
A reviewer opens a document containing hundreds of entity relations and selects Entity Type sorting to group similar relationships together. Instead of scrolling through relations in creation order, related entities are organized into logical groups, making validation faster and improving overall review efficiency.
Quick Navigation and Highlighting for Selected Relations
What’s Improved
Selecting a relation from the Relations panel now automatically navigates to the corresponding entities within the document, making it easier to review and validate relationships. Previously, reviewers had to manually search for the related entities after selecting a relation, which could be time-consuming in documents containing large numbers of annotations.
When a relation is selected, the annotation view automatically scrolls to the relevant location and highlights both associated entities, providing immediate visual context for faster and more efficient review.
Technical Details
-
Automatic Navigation
Selecting a relation from the Relations panel automatically scrolls the document to the associated entities.
-
Entity Highlighting
Both entities participating in the selected relation are highlighted, making it easier to identify and validate the relationship.
-
Optimized Review Workflow
Eliminates the need to manually search through the document, reducing the time required to review relation-heavy annotation tasks.
Note: This enhancement is currently available for NER projects. Support for Visual NER projects will be introduced in a future release.
User Benefits
-
Faster Navigation — Jump directly to the selected relation without manually searching through the document.
-
Improved Visibility — Instantly identify related entities through automatic highlighting.
-
More Efficient Reviews — Validate complex relation annotations more quickly, particularly in documents containing large numbers of relations.
Example Use Case
A reviewer selects a relation from the Relations panel while validating a clinical document containing hundreds of entity relationships. The document automatically navigates to the corresponding location and highlights both related entities, allowing the reviewer to verify the relationship immediately without manually searching the document.
Improved Range Validation for Test Suite Threshold Controls
What’s Improved
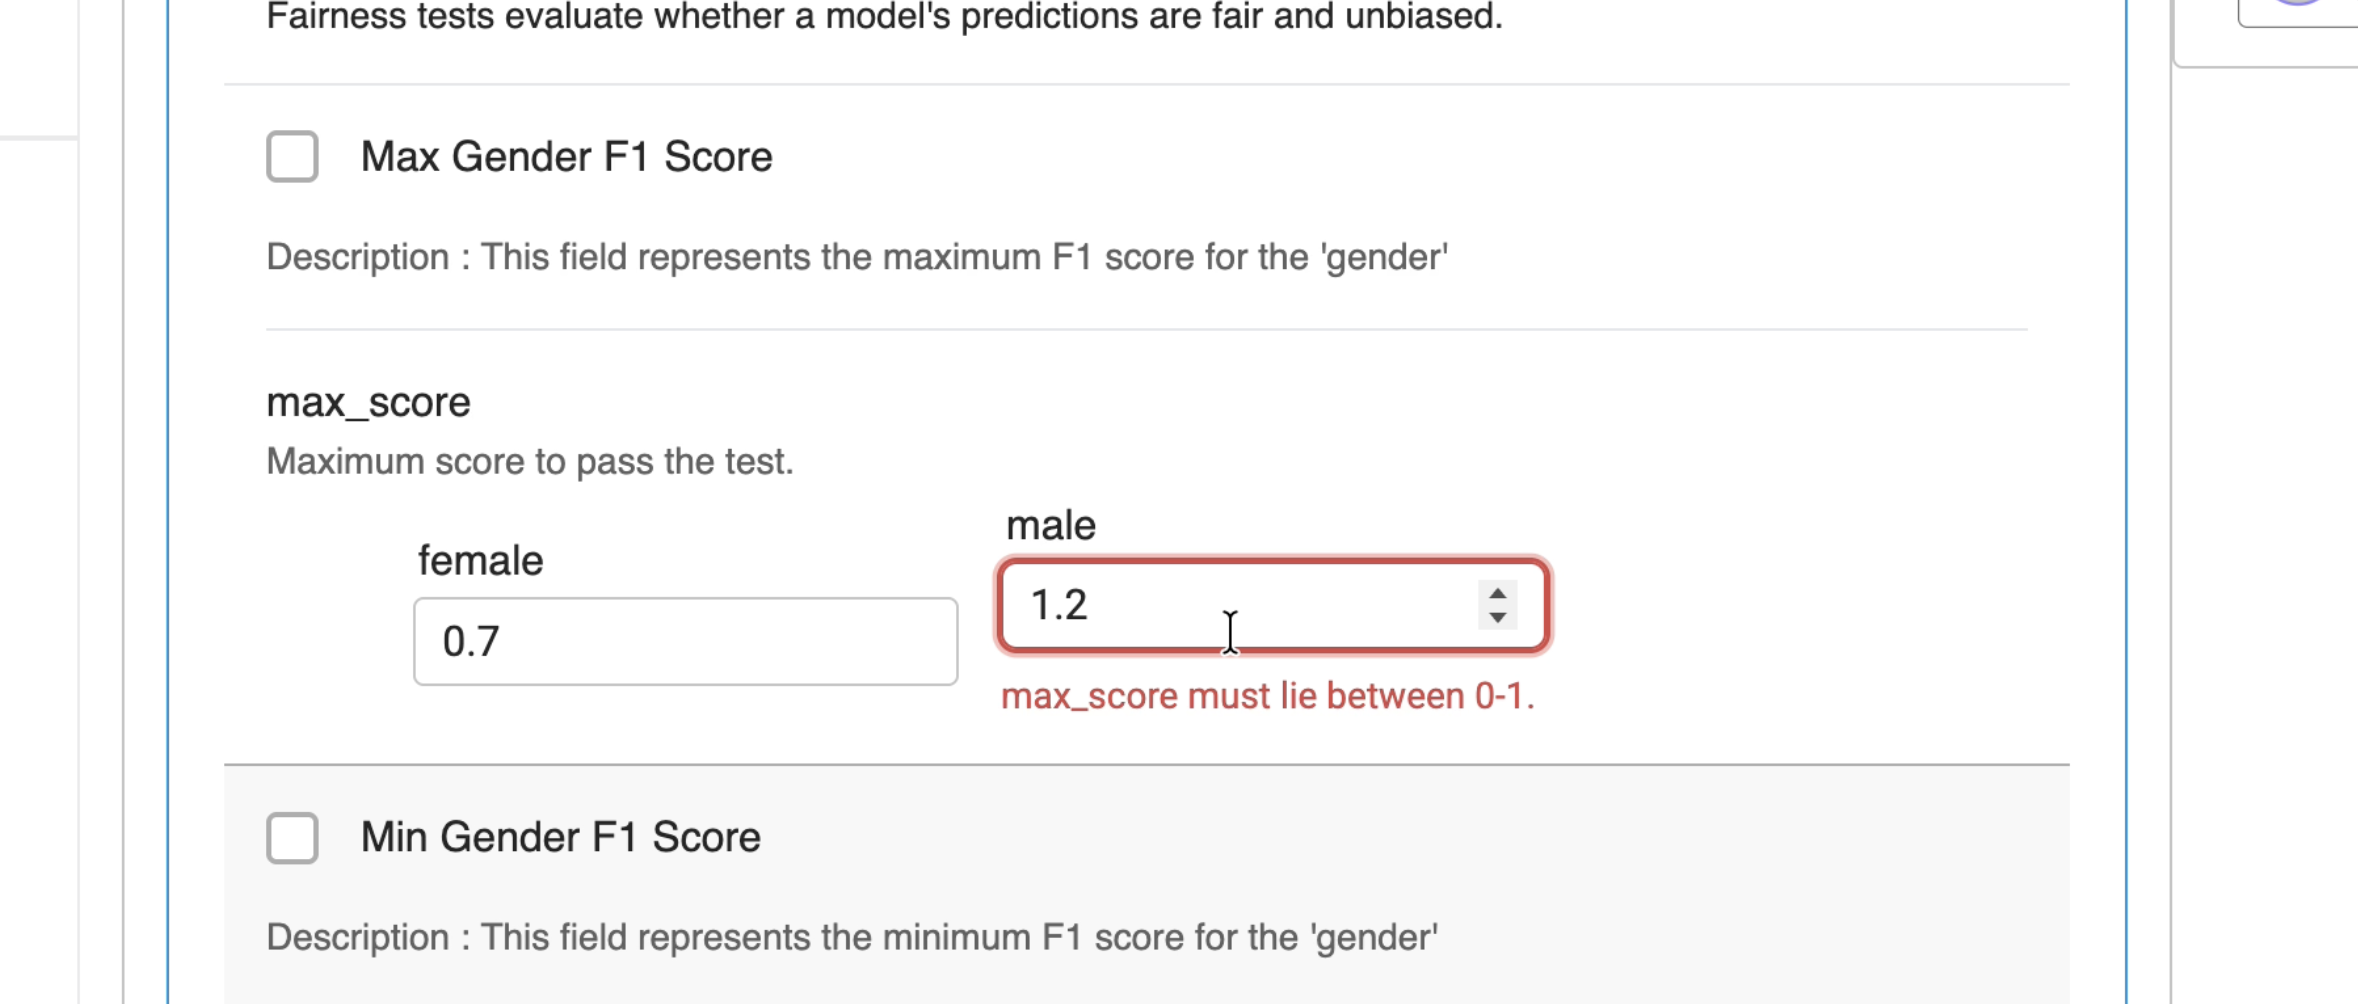
The Test Suite threshold controls now provide more precise and predictable numeric input, making it easier to configure evaluation thresholds accurately. Previously, threshold values could be adjusted beyond the supported range or required less precise input, increasing the likelihood of configuration errors.
The updated numeric control enforces the valid input range while supporting finer adjustment increments, helping users configure threshold values with greater precision and confidence.
Technical Details
-
Restricted Input Range
Threshold values are now restricted to the supported range of 0 to 1. Values outside this range can no longer be entered using either the numeric control or manual input.
-
Improved Adjustment Precision
The increment and decrement step size has been reduced to approximately 0.1, allowing more precise threshold configuration.
-
Built-in Input Validation
Range validation is applied directly within the numeric input control, preventing unsupported values and reducing configuration errors.
User Benefits
-
Accurate Configuration — Restrict threshold values to the supported range of 0 to 1.
-
Greater Precision — Fine-grained adjustment steps simplify tuning of evaluation thresholds.
-
Improved User Experience — Numeric controls behave consistently and prevent unsupported input.
-
Reduced Configuration Errors — Built-in validation eliminates accidental selection of invalid values.
Example Use Case
A project manager configures threshold values for a Test Suite evaluation. Using the updated numeric control, they fine-tune the threshold with small incremental adjustments while the platform automatically restricts values to the supported range of 0 to 1, ensuring accurate configuration without additional validation.
Independent Space and Punctuation Trimming Controls
What’s Improved
Generative AI Lab now provides independent controls for trimming whitespace and punctuation during annotation. Previously, both behaviors were combined into a single setting, making it impossible to remove unwanted spaces without also removing punctuation that could be clinically or semantically significant.
The updated configuration separates these behaviors into two independent options, giving annotation teams greater control over text selection while preserving important symbols when required.
Technical Details
-
Independent Trimming Controls
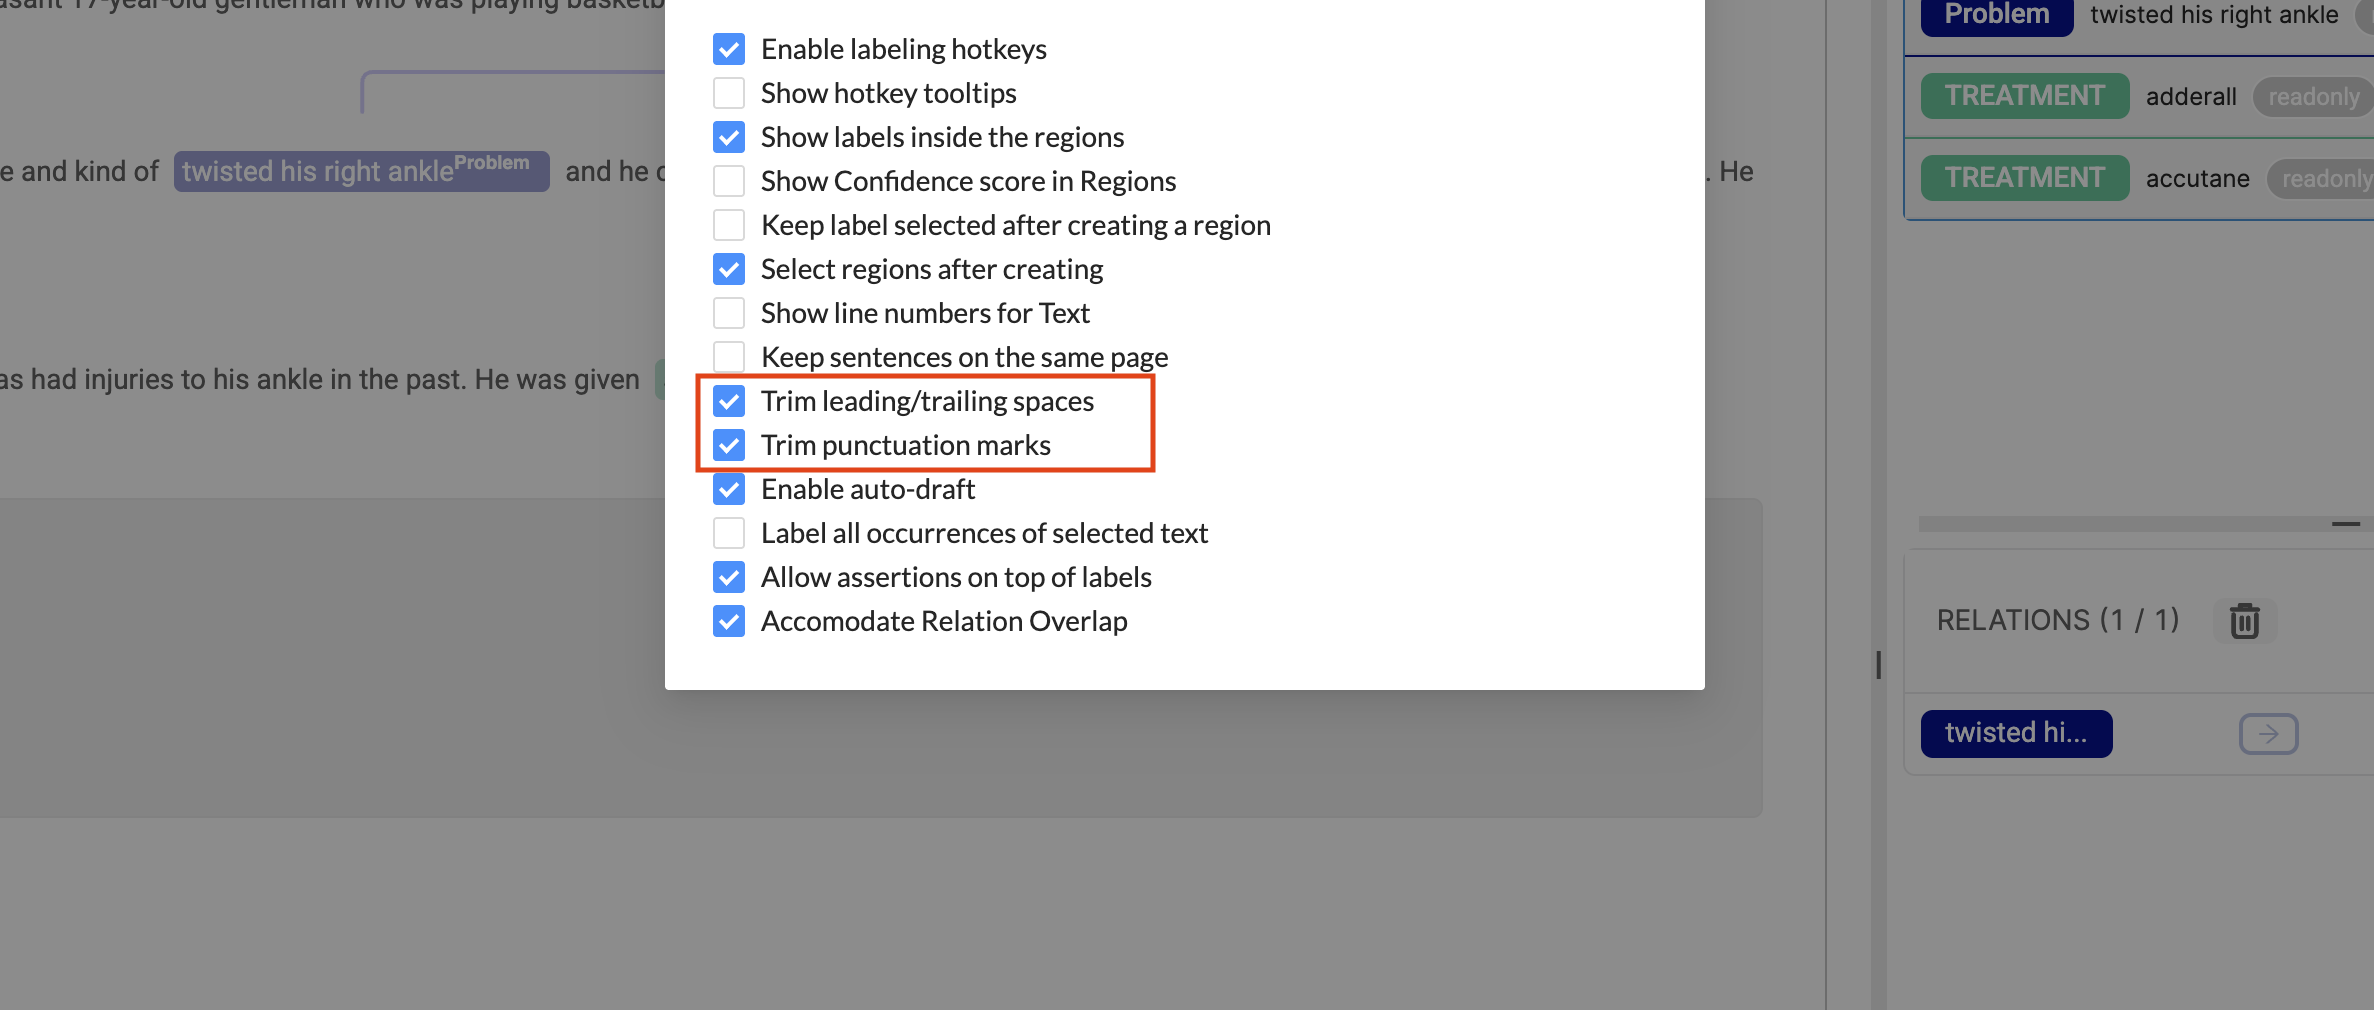
The previous Trim spaces and punctuation marks setting has been replaced with two independent configuration options:
- Trim leading/trailing spaces
- Trim punctuation marks
Each option can be enabled or disabled independently.
-
Whitespace Trimming
When enabled, Trim leading/trailing spaces automatically removes surrounding whitespace while preserving punctuation and symbols. This improves double-click and rapid span selection workflows without modifying annotated content.
-
Punctuation Trimming
When enabled, Trim punctuation marks removes punctuation characters from the boundaries of selected text. When disabled, symbols such as
%,+,/, and-are preserved, helping maintain clinically significant values and expressions. -
Automatic Settings Migration
Existing projects retain their previous behavior after upgrading. Projects that had the original combined setting enabled will automatically have both new options enabled, while projects with the setting disabled will continue with both options disabled.
User Benefits
-
Greater Annotation Control — Configure whitespace and punctuation trimming independently to match project requirements.
-
Preserved Clinical Context — Retain clinically significant symbols while removing unwanted whitespace.
-
Faster Text Selection — Improve annotation speed during span selection without compromising annotation accuracy.
-
Seamless Upgrade Experience — Existing project behavior is preserved automatically through configuration migration.
Example Use Case
A healthcare annotation team is labeling laboratory results containing values such as 98% and Na+/K+. By enabling Trim leading/trailing spaces while leaving Trim punctuation marks disabled, annotators can remove accidental whitespace without affecting clinically significant symbols, resulting in faster and more accurate annotations.
Bug Fixes
Critical Bug Fixes & Stability
-
Error When Selecting Auto-Draft Saved Regions in Visual NER Projects
Selecting a region that had been automatically saved using the auto-draft feature could redirect users to a “Something Went Wrong” page, preventing further interaction with the annotation. Auto-draft regions now open correctly, allowing users to continue editing and save annotations without interruption.
-
Annotations Become Invisible After Zooming in Side-by-Side Projects
Annotations could disappear after zooming and selecting an annotation in Side-by-Side projects, making review and editing difficult. Annotation rendering has been improved to ensure annotations remain visible and correctly highlighted during zoom operations.
-
Annotations Disappear When Selecting Labels in Side-by-Side Projects
Selecting annotated labels in Side-by-Side projects could temporarily hide existing annotations, disrupting the annotation workflow. Annotation visibility has been corrected so annotations remain visible throughout label selection.
-
Relations Hidden When Label Visibility Is Set to Hidden
Relations associated with annotations could disappear from the Annotation Widget when label visibility was disabled, making relation review difficult. Relation rendering has been updated so relations remain visible and behave correctly regardless of the label visibility setting.
-
Unable to Import Zipped Audio and Video Files
ZIP archives containing audio or video tasks could fail during import, even when uploaded into the corresponding project type. Import handling has been updated to support ZIP-based Audio and Video task imports successfully.
-
“License Not Found” Error When Saving Healthcare Training with Universal License
Saving Healthcare Training configurations could incorrectly display a “License not found” error despite a valid Universal License being available. License validation has been corrected so Healthcare Training configurations save successfully when supported licenses are present.
Core Functional Improvements
-
Last Task Import Status Missing for Audio, Video, and Visual NER Projects
The most recent task import status was not displayed for Audio, Video, and Visual NER projects, making it difficult to verify import progress. Import status reporting has been corrected so the latest import activity is displayed consistently across supported project types.
-
False “Something Went Wrong” Error After Successfully Importing Rules
Rules could be imported successfully in the background while the interface incorrectly displayed a “Something Went Wrong” message until the page was refreshed. Import status reporting now accurately reflects successful rule imports without displaying false error messages.
-
Missing “Click Here” Navigation in Maximum Server Limit Popup
When the maximum server limit was reached, the notification dialog did not provide a direct way to navigate to the Cluster page. The dialog now includes a Click Here action that opens the Cluster page for faster server management.
-
Error When Accessing Settings for “Generate Augmented Templates with OpenAI”
Opening the settings for Generate Augmented Templates with OpenAI could redirect users to a “Something Went Wrong” page instead of displaying the configuration dialog. Settings navigation has been corrected, allowing template generation options to be accessed and configured normally.
-
Previously Selected LLM Not Preserved When Editing External Prompts
Editing an existing external prompt could replace the previously selected LLM with a newly created or default model. External prompt editing now preserves the originally selected LLM, ensuring existing configurations remain unchanged.
UI/UX & Visual Enhancements
-
Zoom Level Remains Stuck After Switching from De-Identification to Annotation View
After switching from the De-Identification view back to the Annotation view, the zoom level could remain locked, preventing users from returning to the default zoom level. Zoom state management has been corrected so users can freely zoom in and out after changing views.
-
Hex Color Code Field Accepts Unlimited Characters
The hexadecimal color input in the Edit Label dialog accepted unrestricted text input, allowing invalid color values to be entered. Input validation now limits hexadecimal color values to six characters, ensuring valid color configuration.
-
Unable to Unhide Individual Labels When Bulk Hide Is Enabled
Individual labels could not be restored after enabling the Hide All Regions option, limiting users to an all-or-nothing visibility workflow. Label visibility controls have been corrected so individual labels can be shown independently while preserving bulk hide functionality.