Analytics Charts
By default, the Analytics page is disabled for every project because computing the analytical charts is a resource-intensive task and might temporarily influence the responsiveness of the application, especially when triggered in parallel with other training/preannotation jobs. However, users can file a request to enable the Analytics page which can be approved by any admin user. The request is published on the Analytics Requests page, visible to any
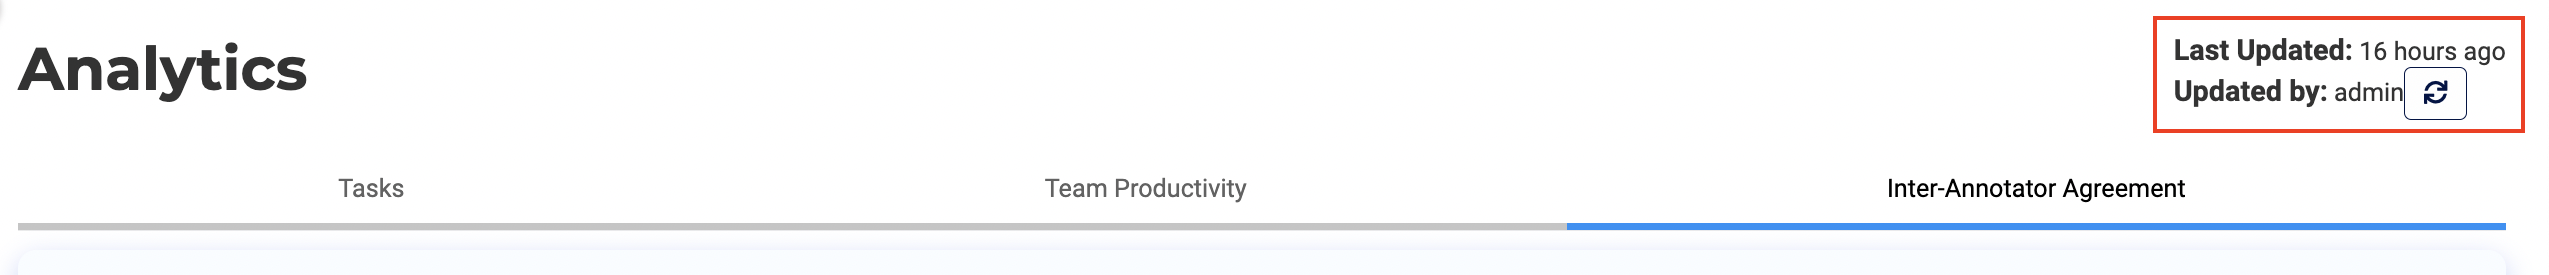
A refresh button is present on the top-right corner of the Analytics page. The Analytics charts doesn’t automatically reflect the changes made by the annotators (like creating tasks, adding new completion, etc.). Updating the analytics to reflect the latest changes can be done using the refresh button.
Note: In evaluation projects with multiple rating questions, analytics aggregate results per question so teams can compare models or responses across individual criteria (e.g., accuracy, coherence, safety) without additional setup.
Task Analytics
To access Task Analytics, navigate on the first tab of the
Below are the charts included in the Tasks section.
Total number of task in the Project

Total number of task in a Project in last 30 days

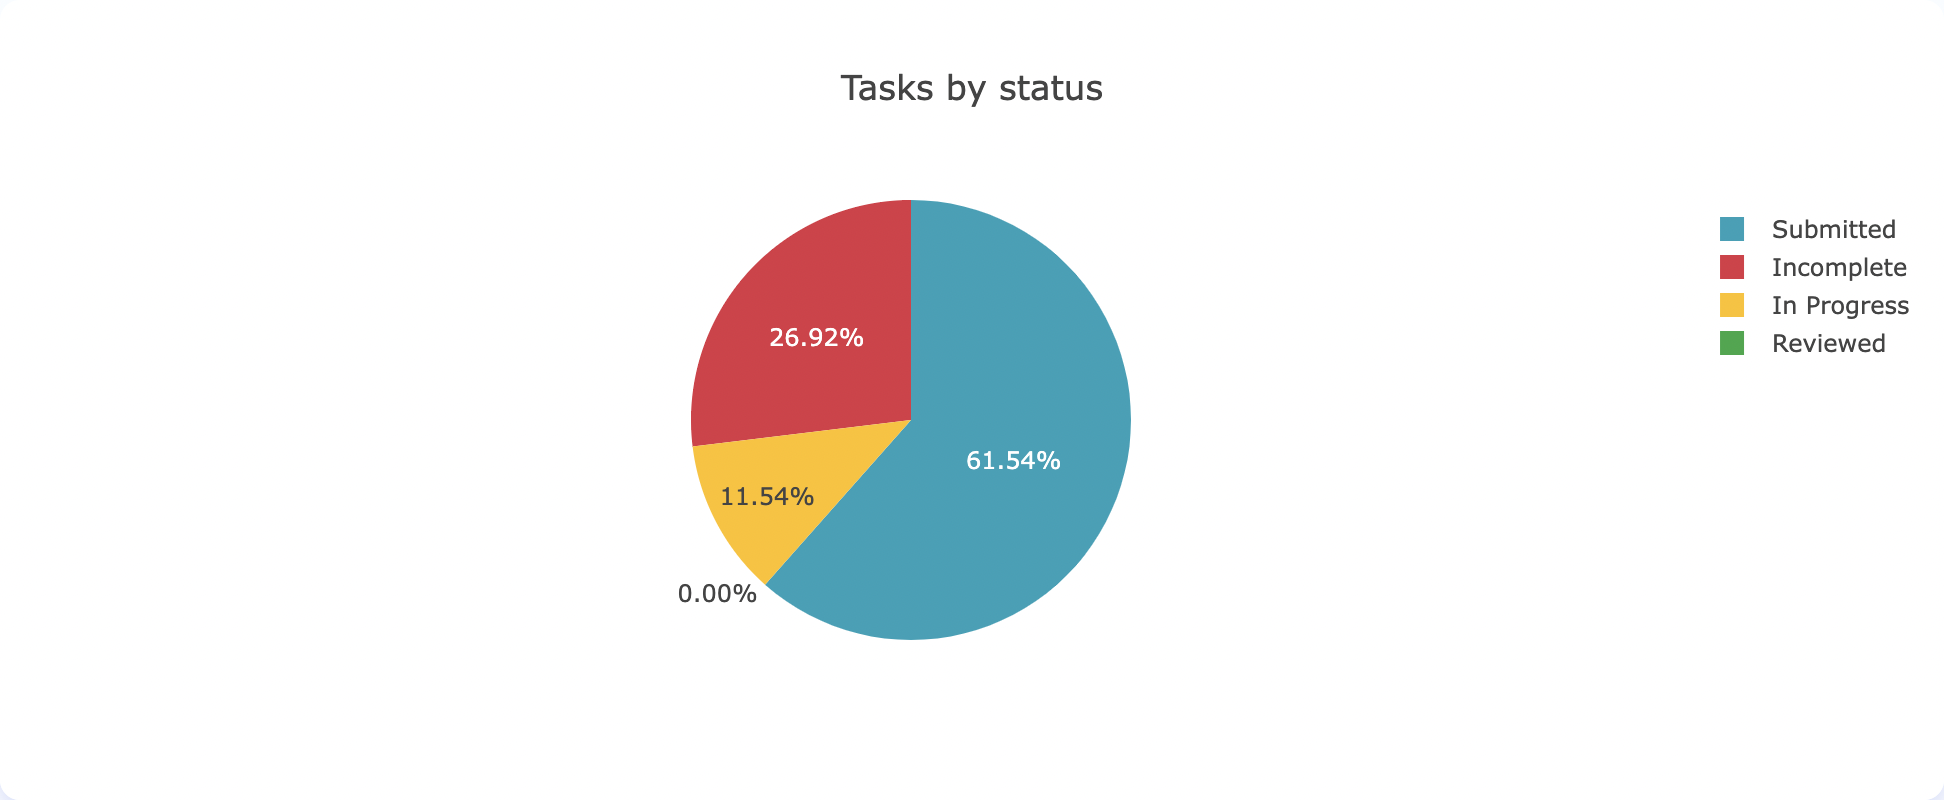
Breakdown of task in the Project by Status
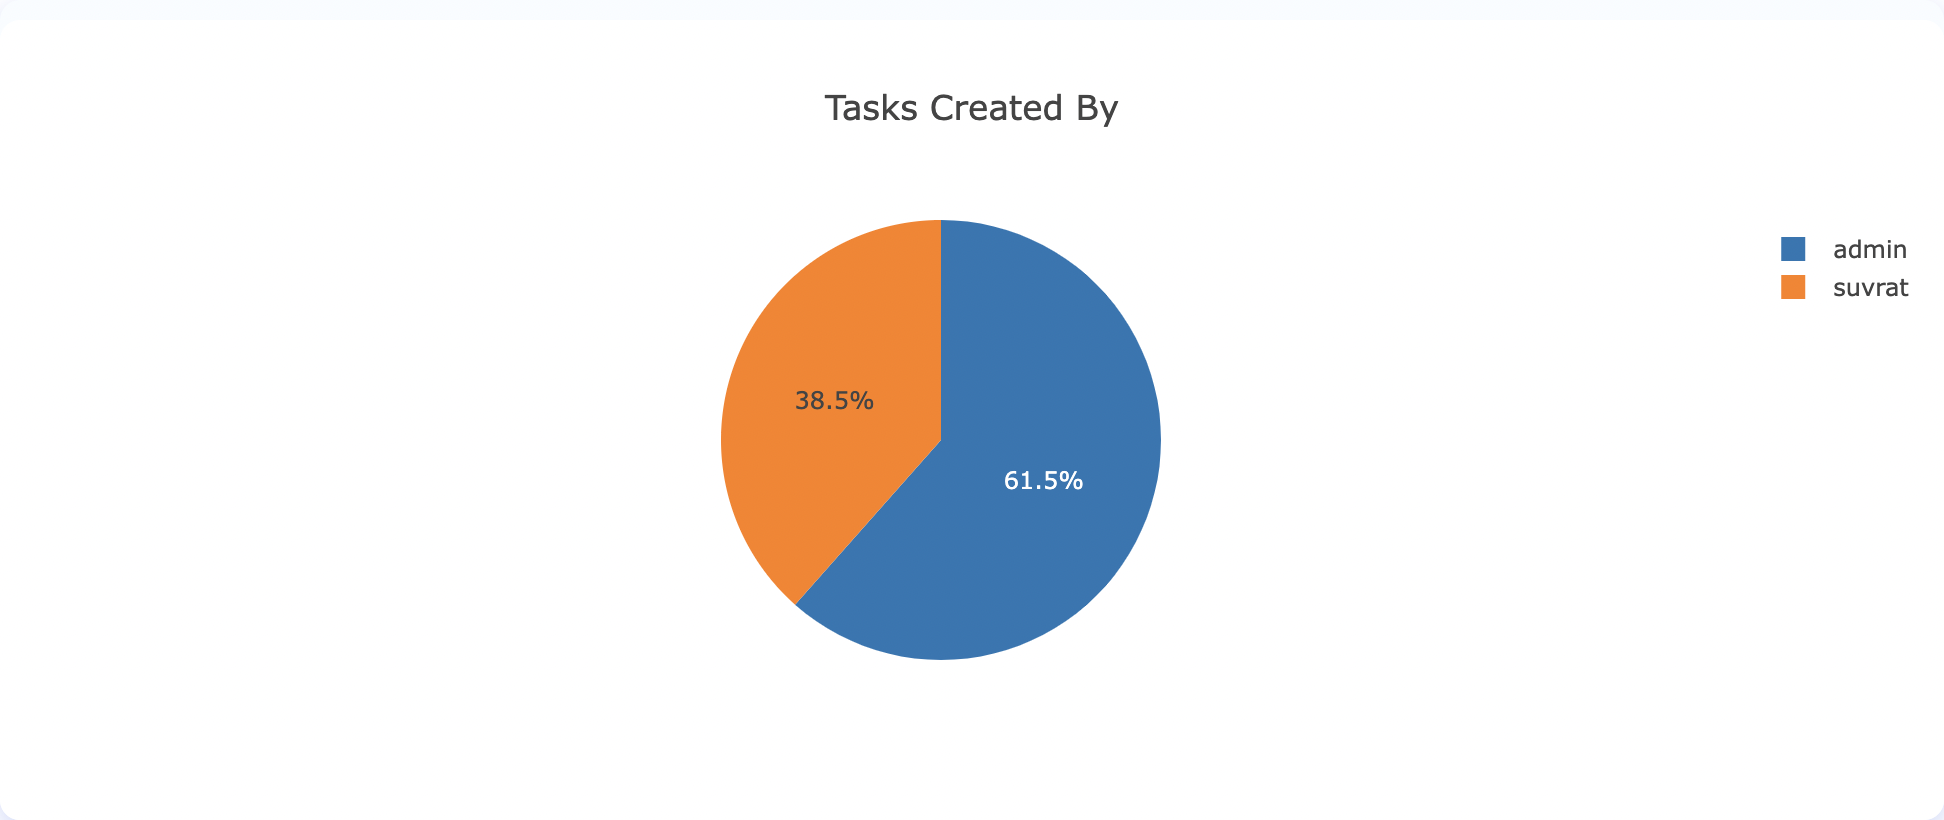
Breakdown of task by author
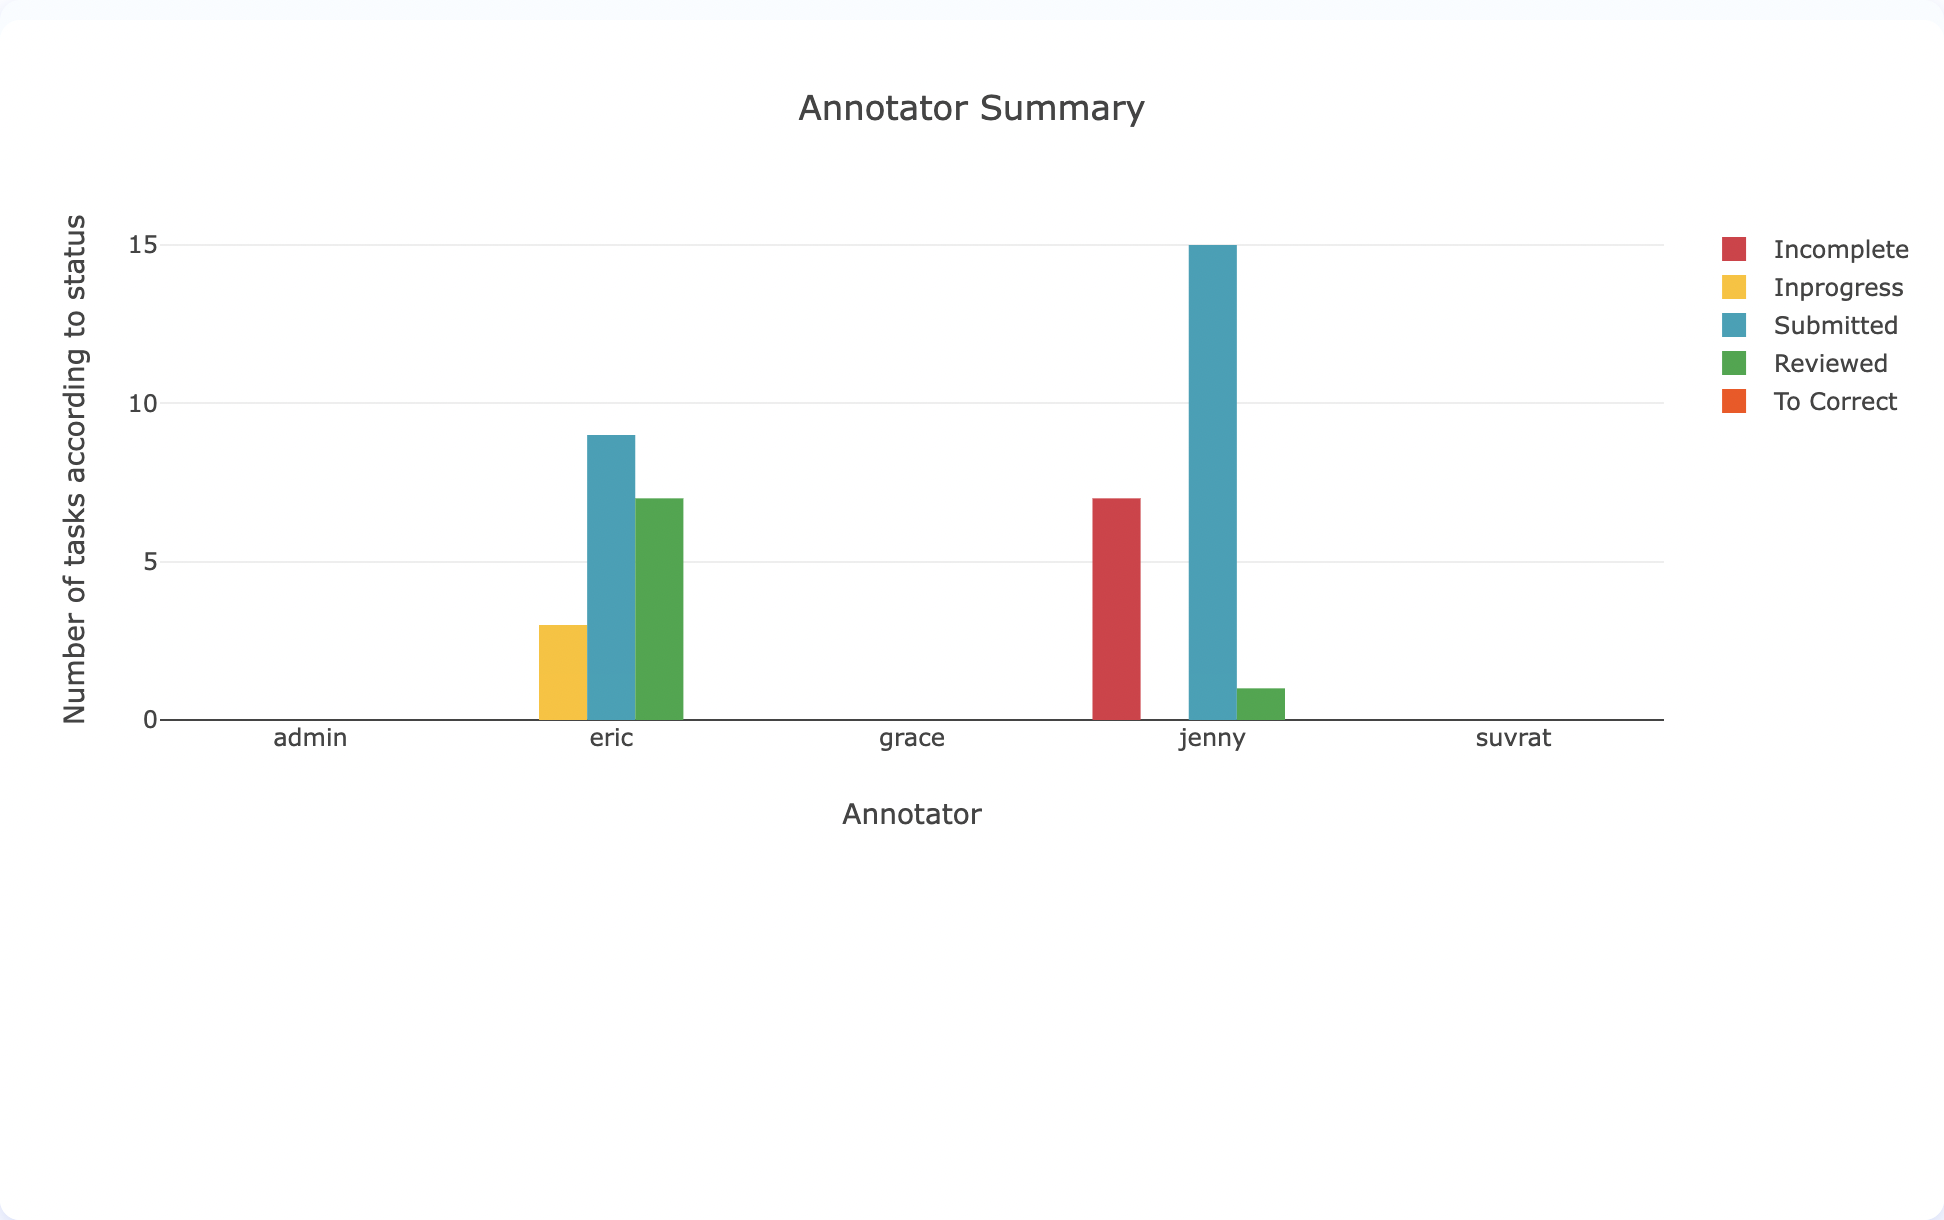
Summary of task status for each annotator
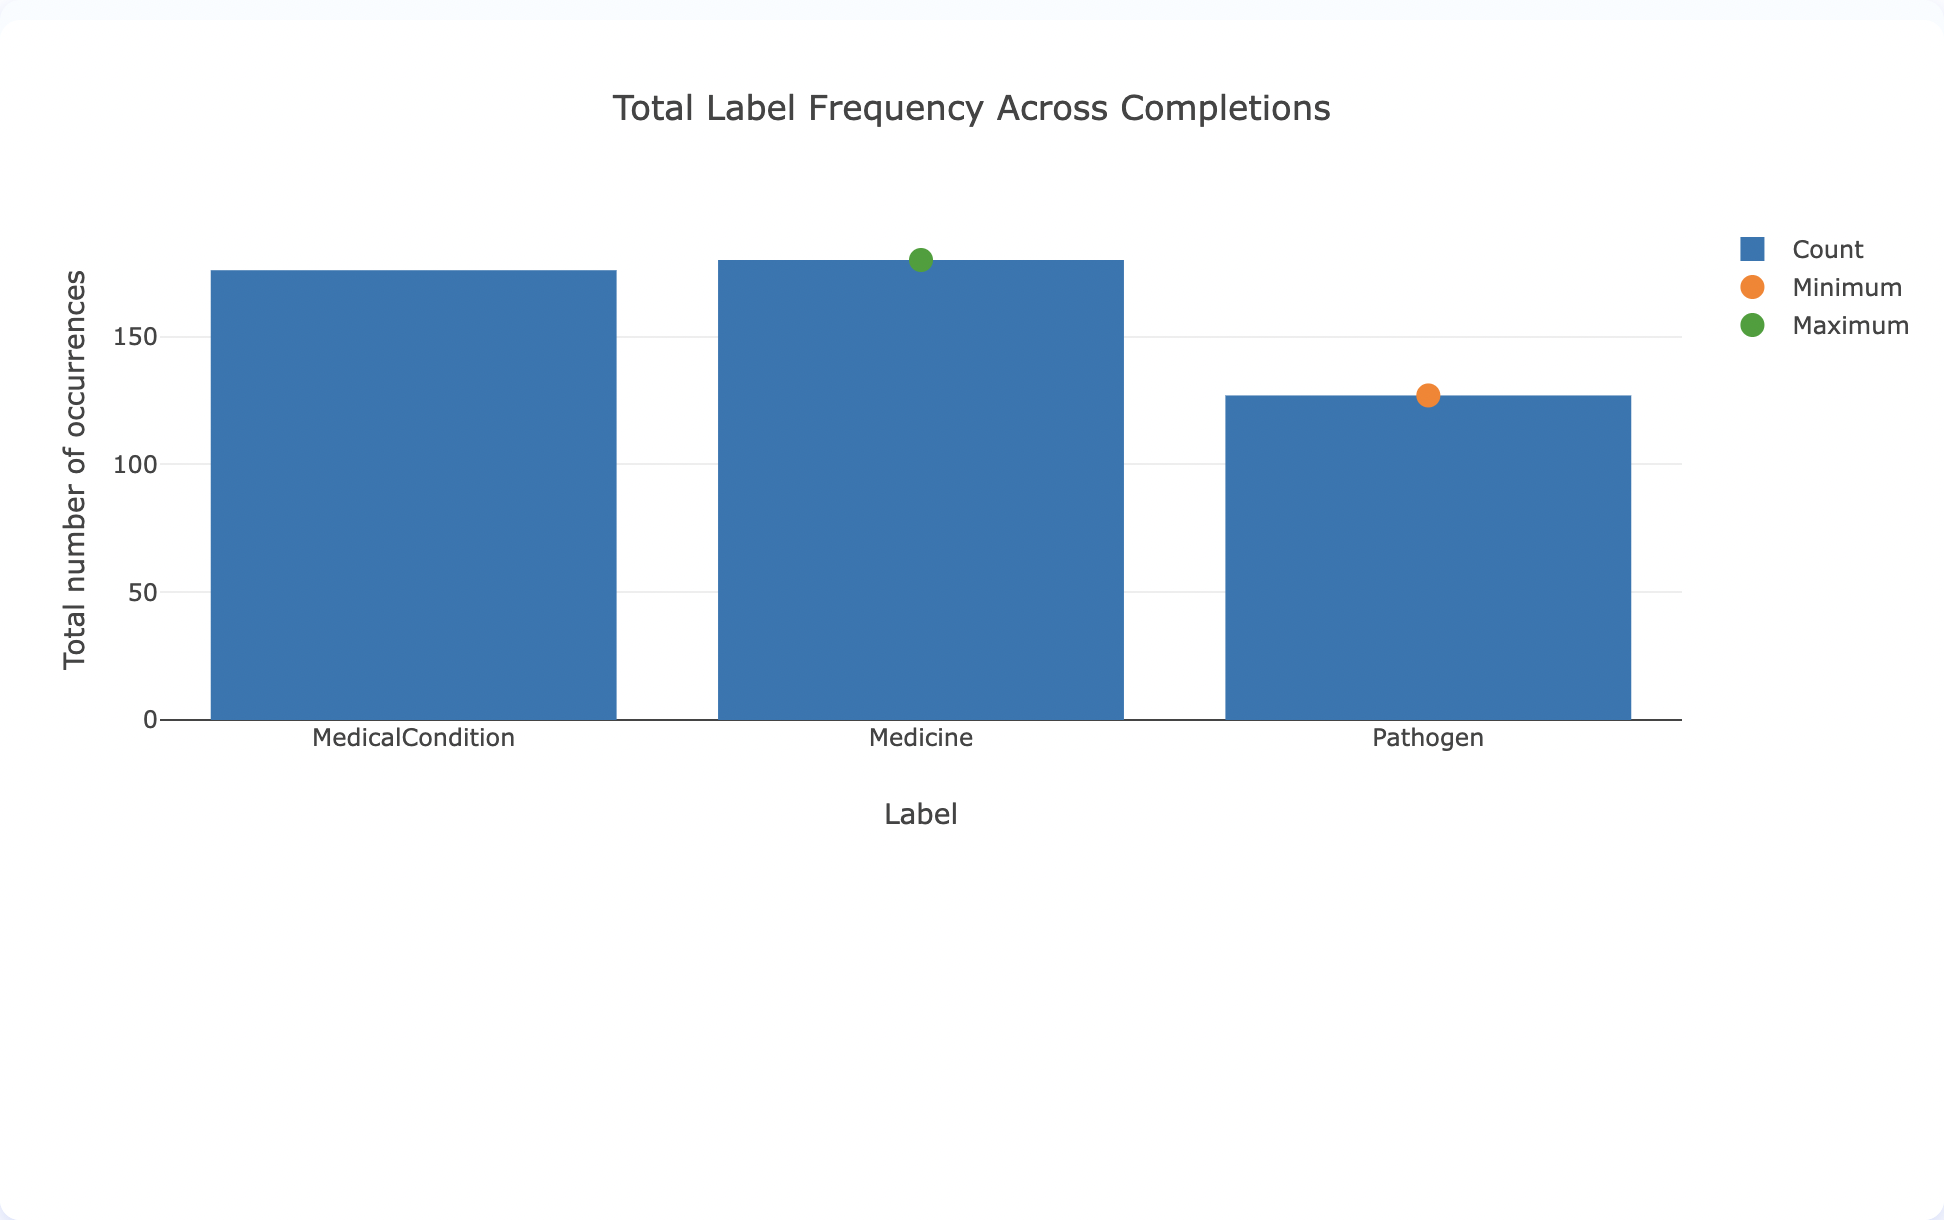
Total number of label occurrences across all completions
Average number of label occurrences for each completion

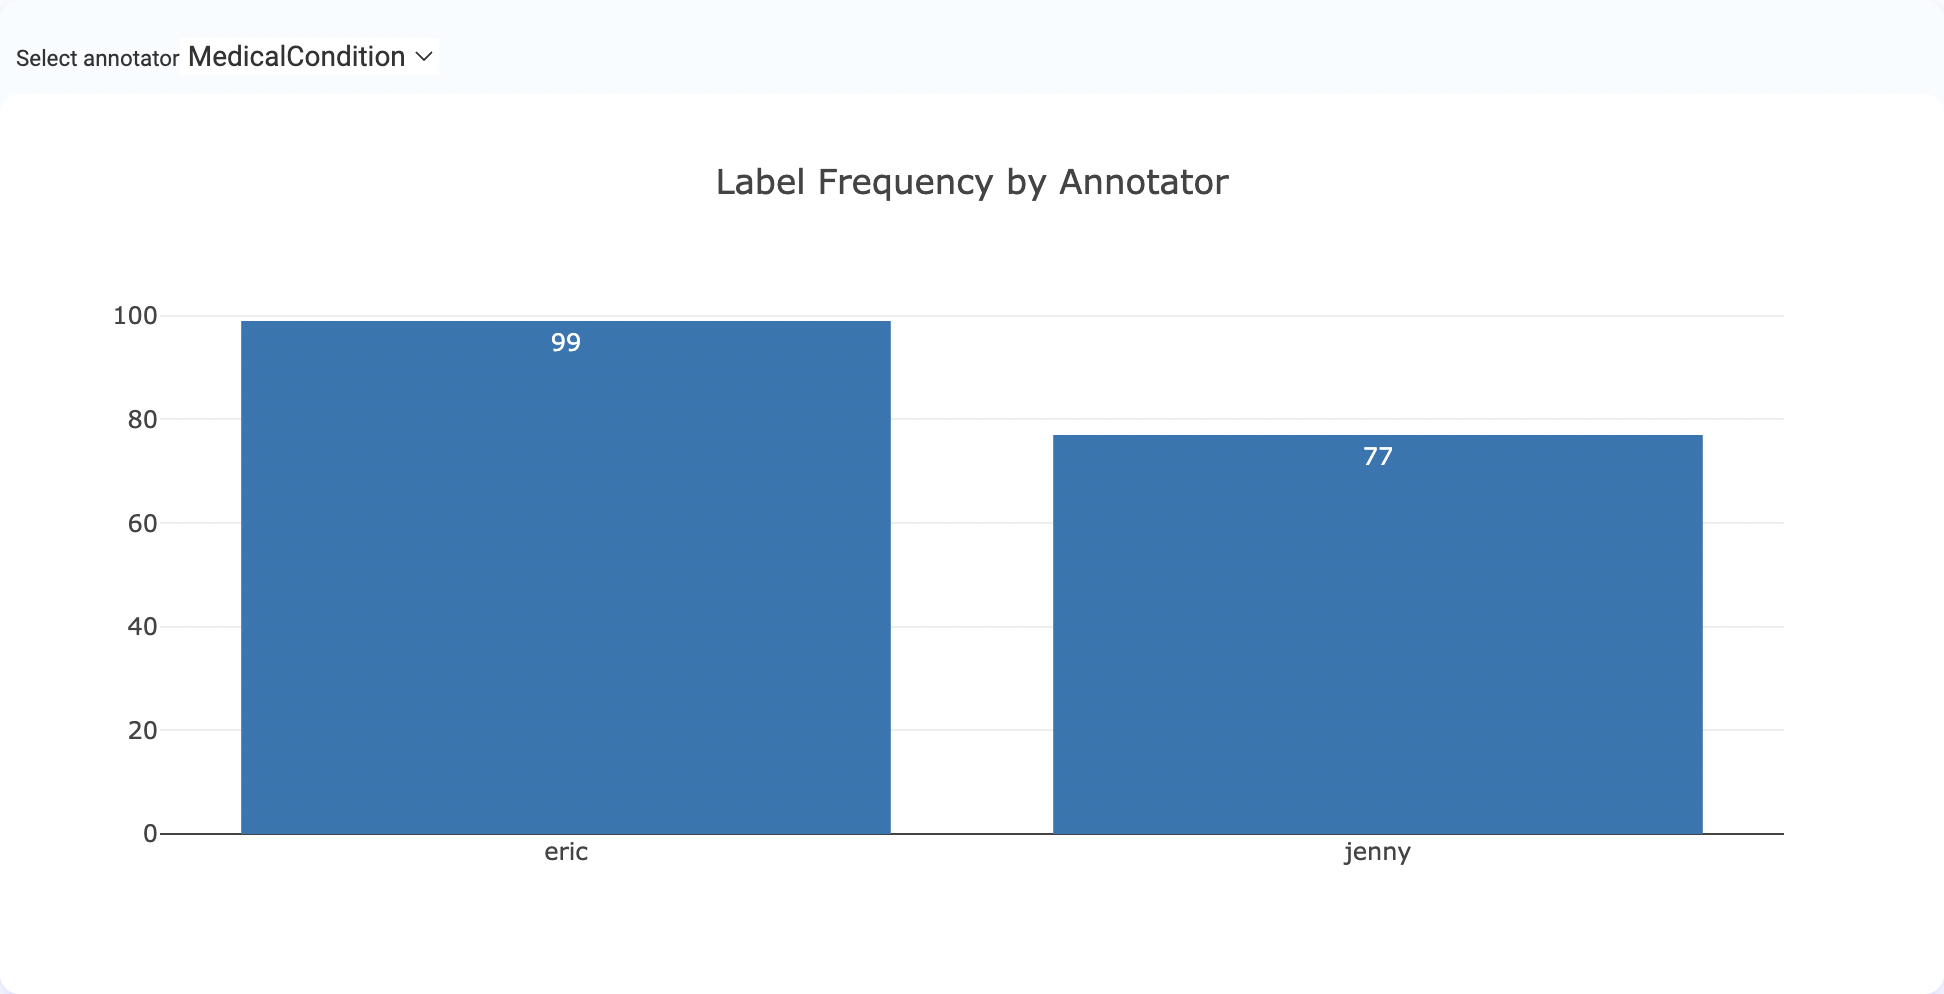
Total number of label occurrences across all completions for each annotator
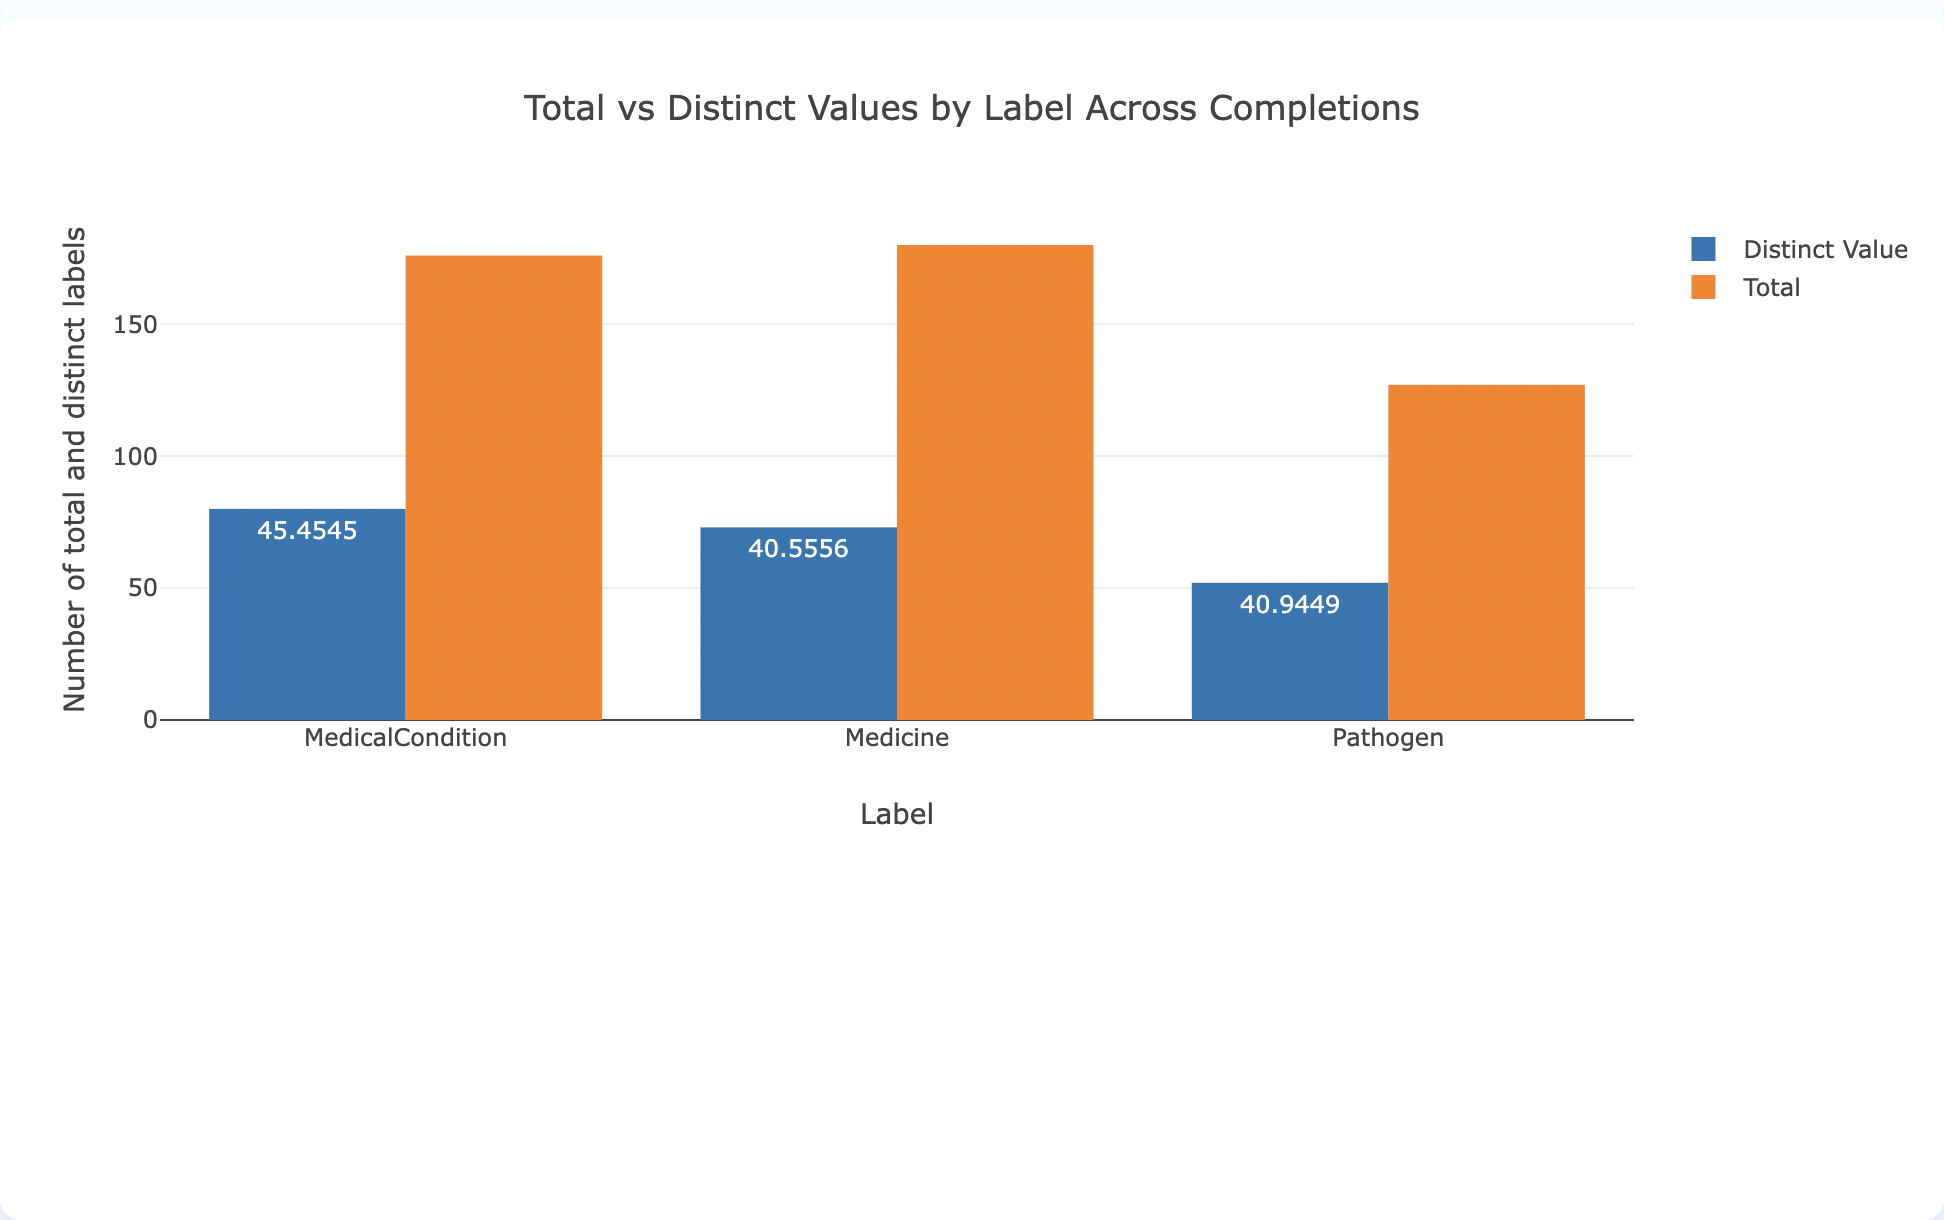
Total vs distinct count of labels across all completions
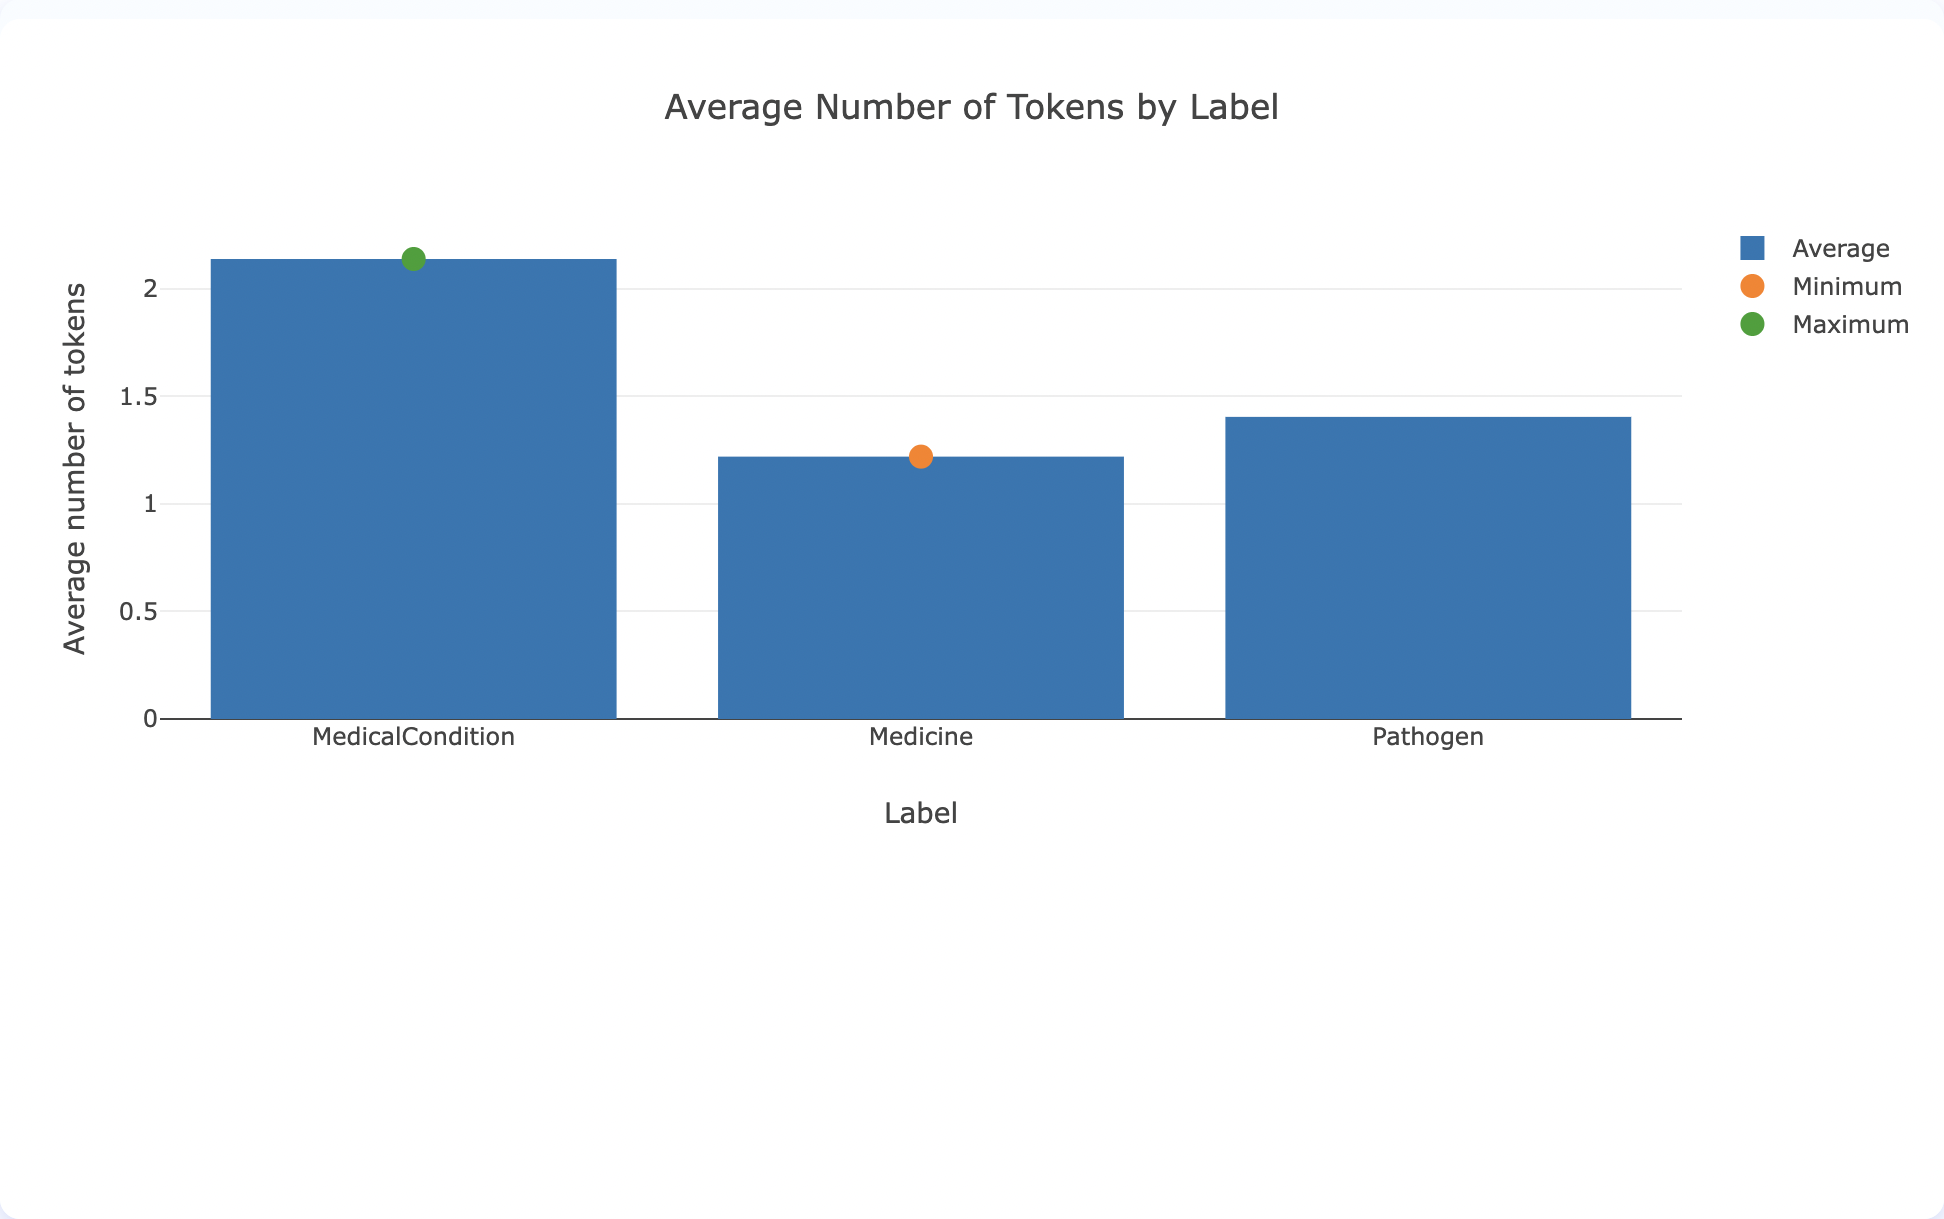
Average number of tokens by label
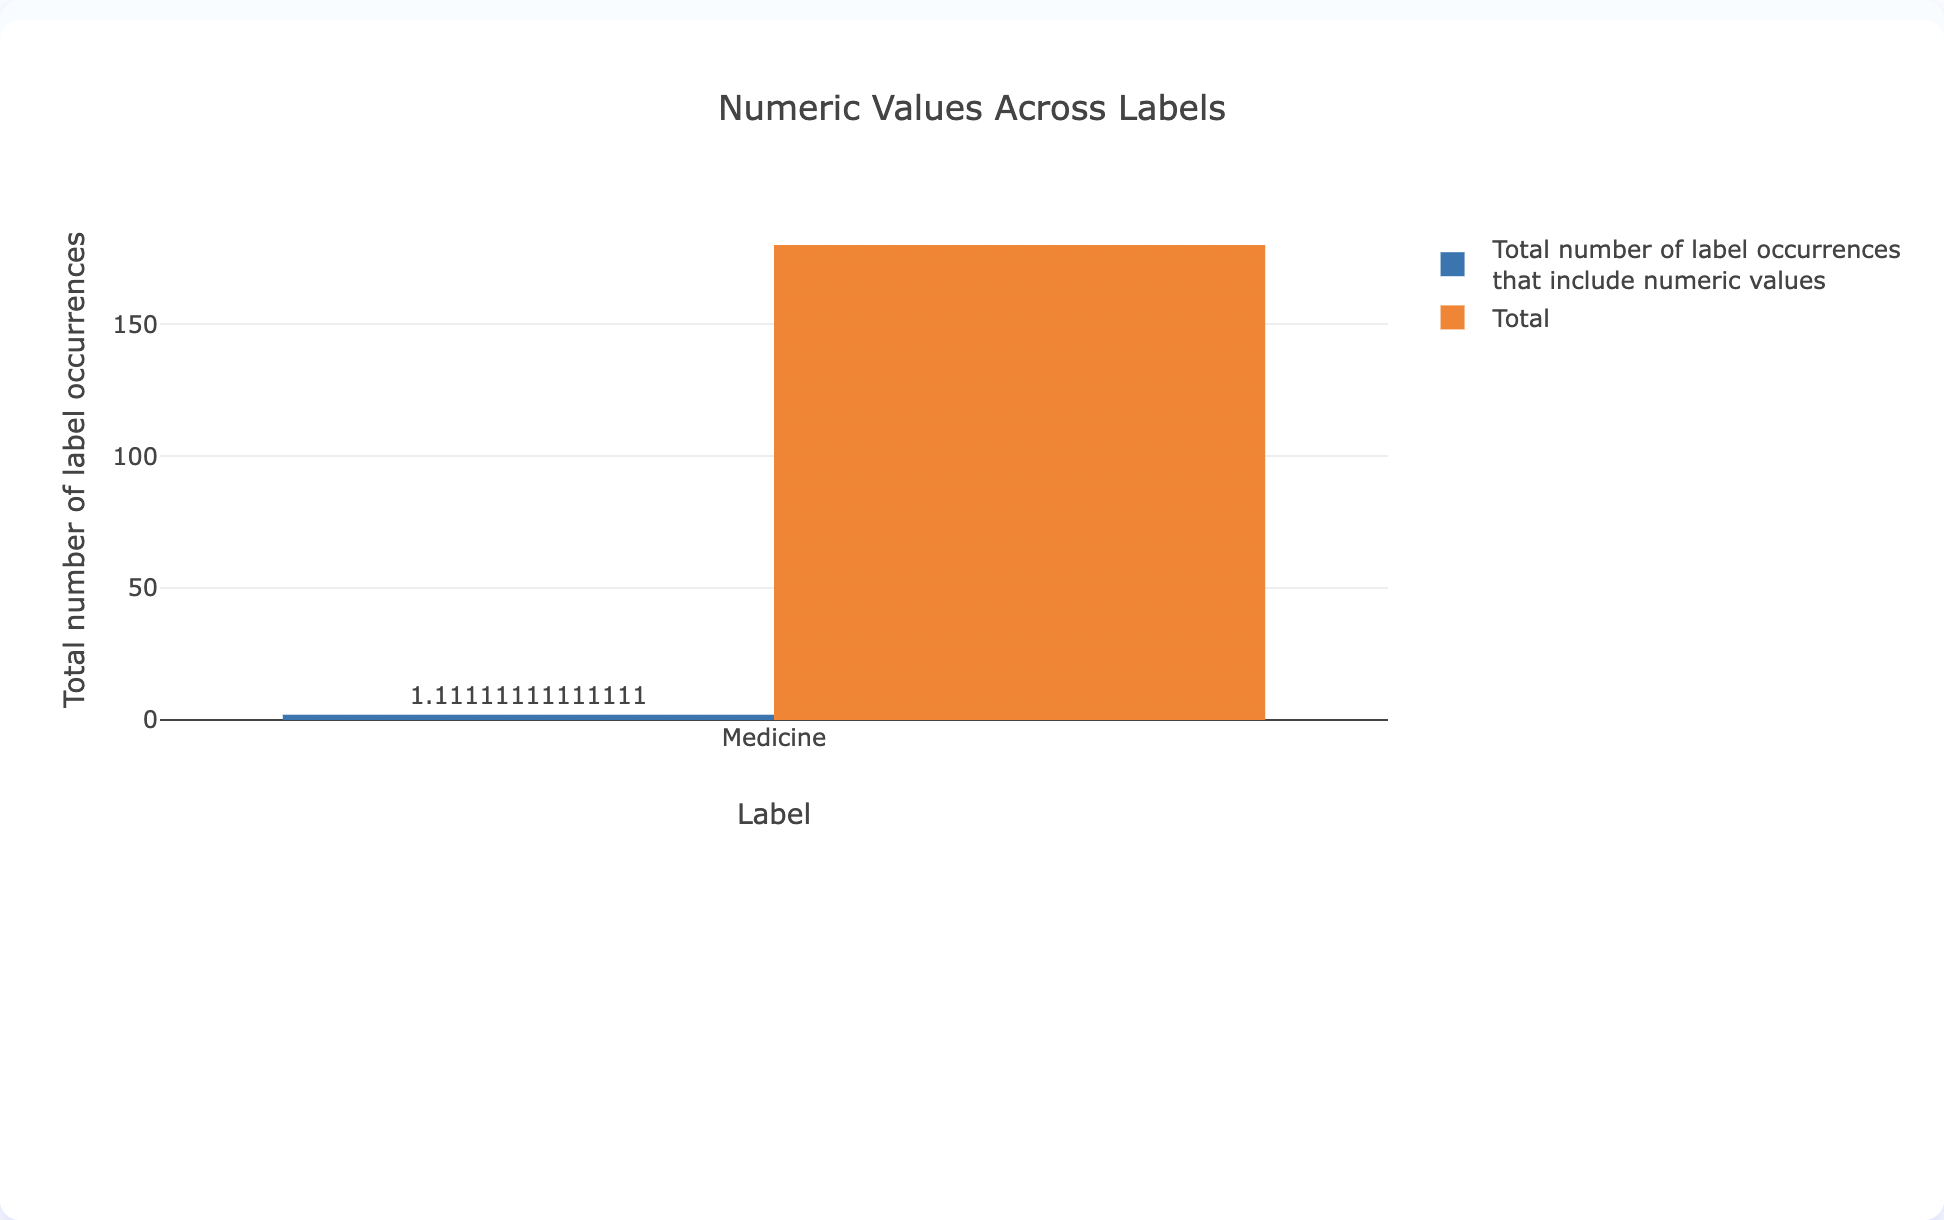
Total number of label occurrences that include numeric values
Team Productivity
To access Team Productivity charts, navigate on the second tab of the
Below are the charts included in the Team Productivity section.
Total number of completions in the Project

Total number of completions in the Project in the last 30 days

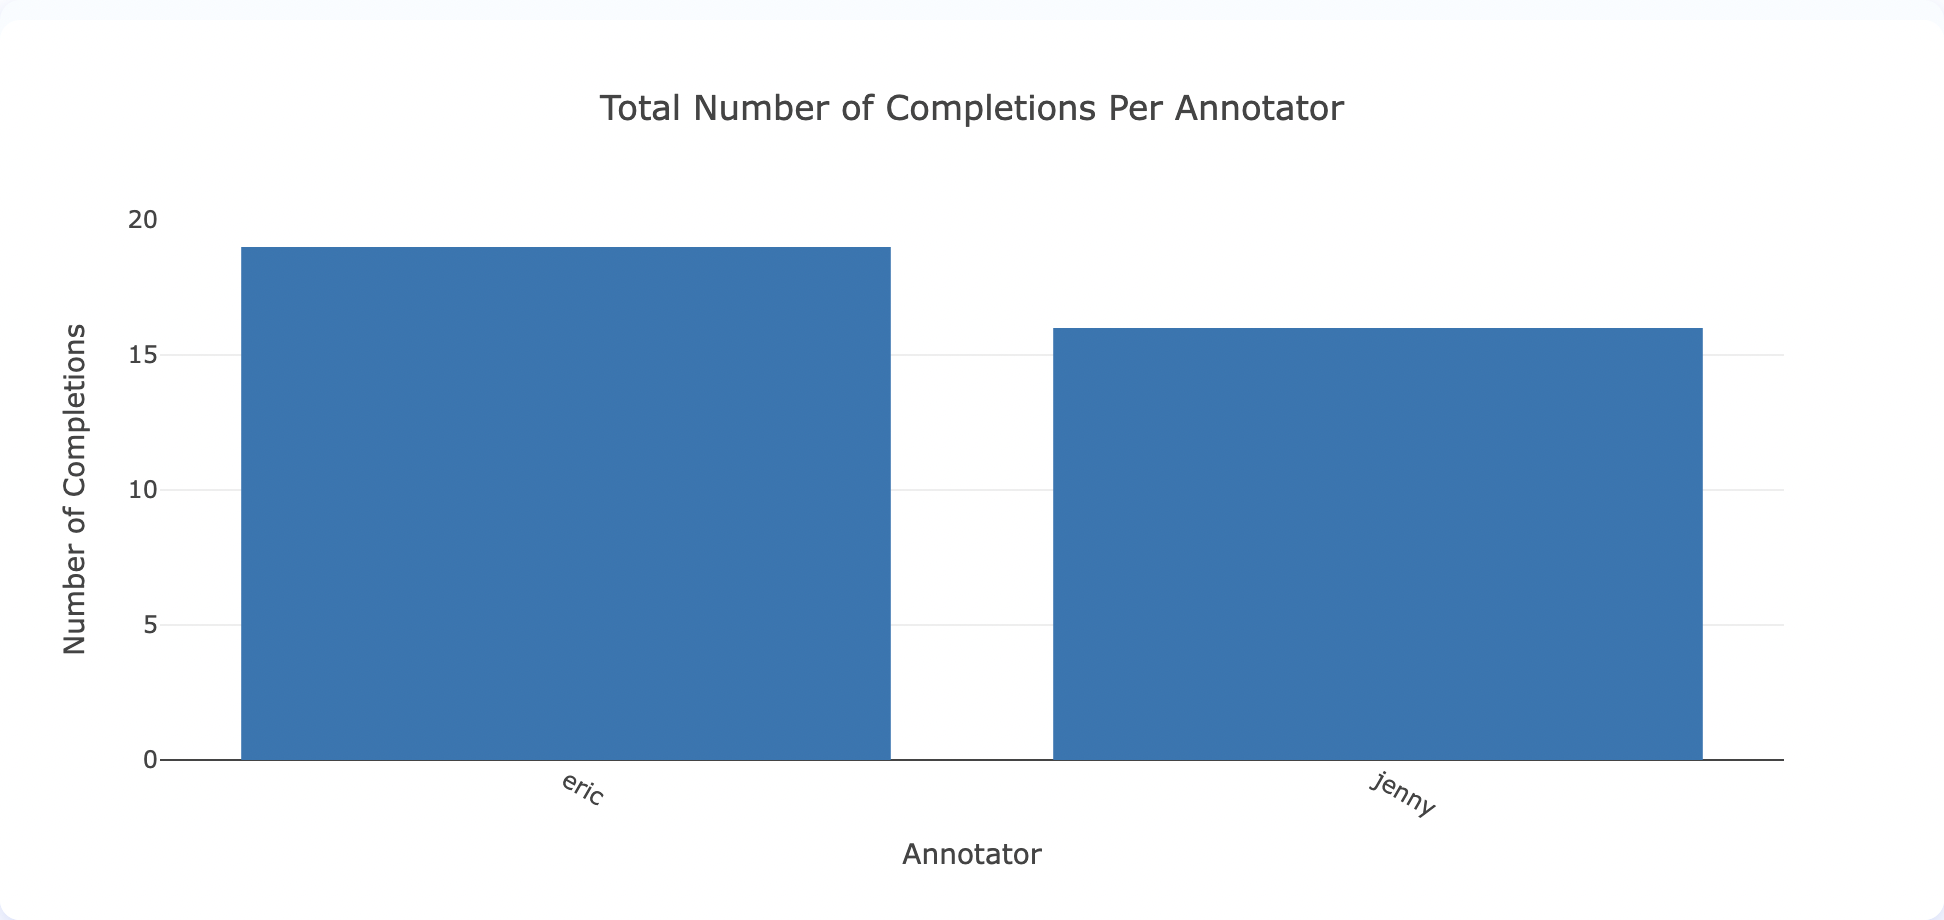
Total number of completions for each Annotator
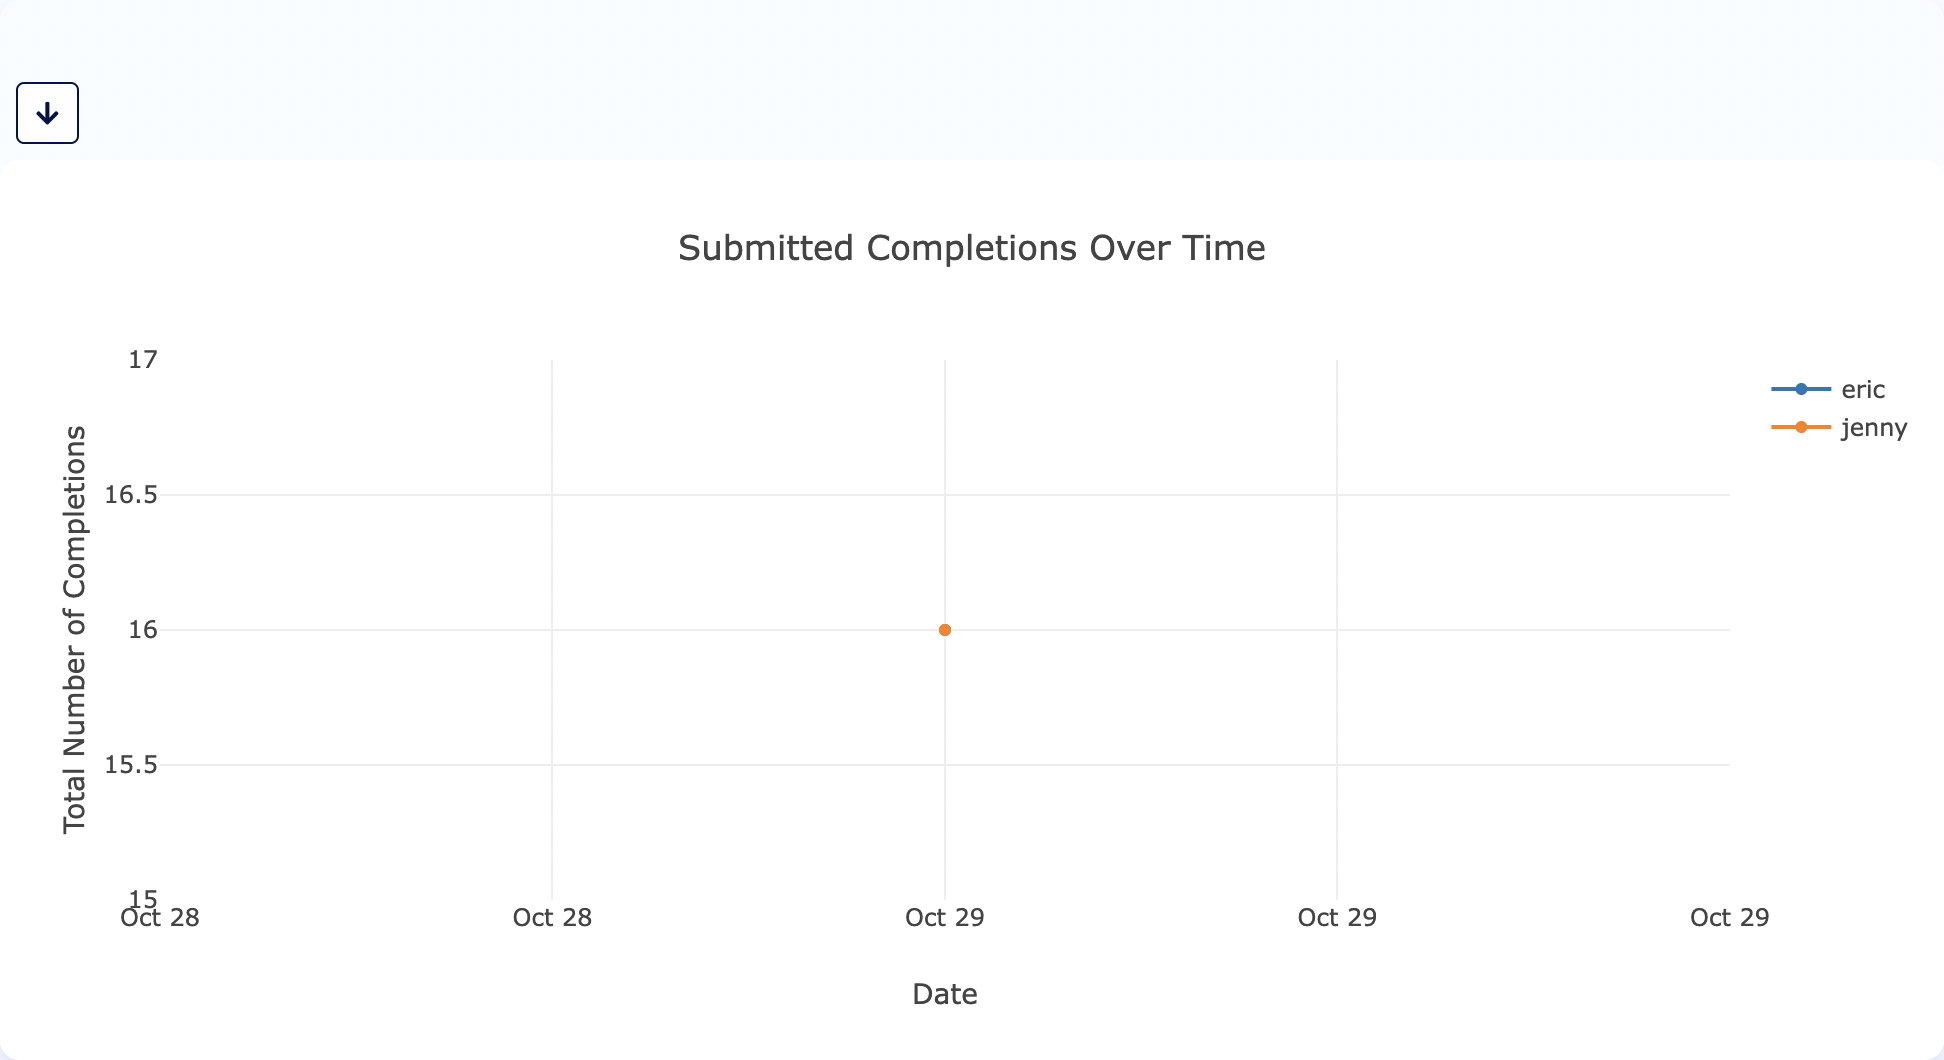
Total number of completions submitted over time for each Annotator
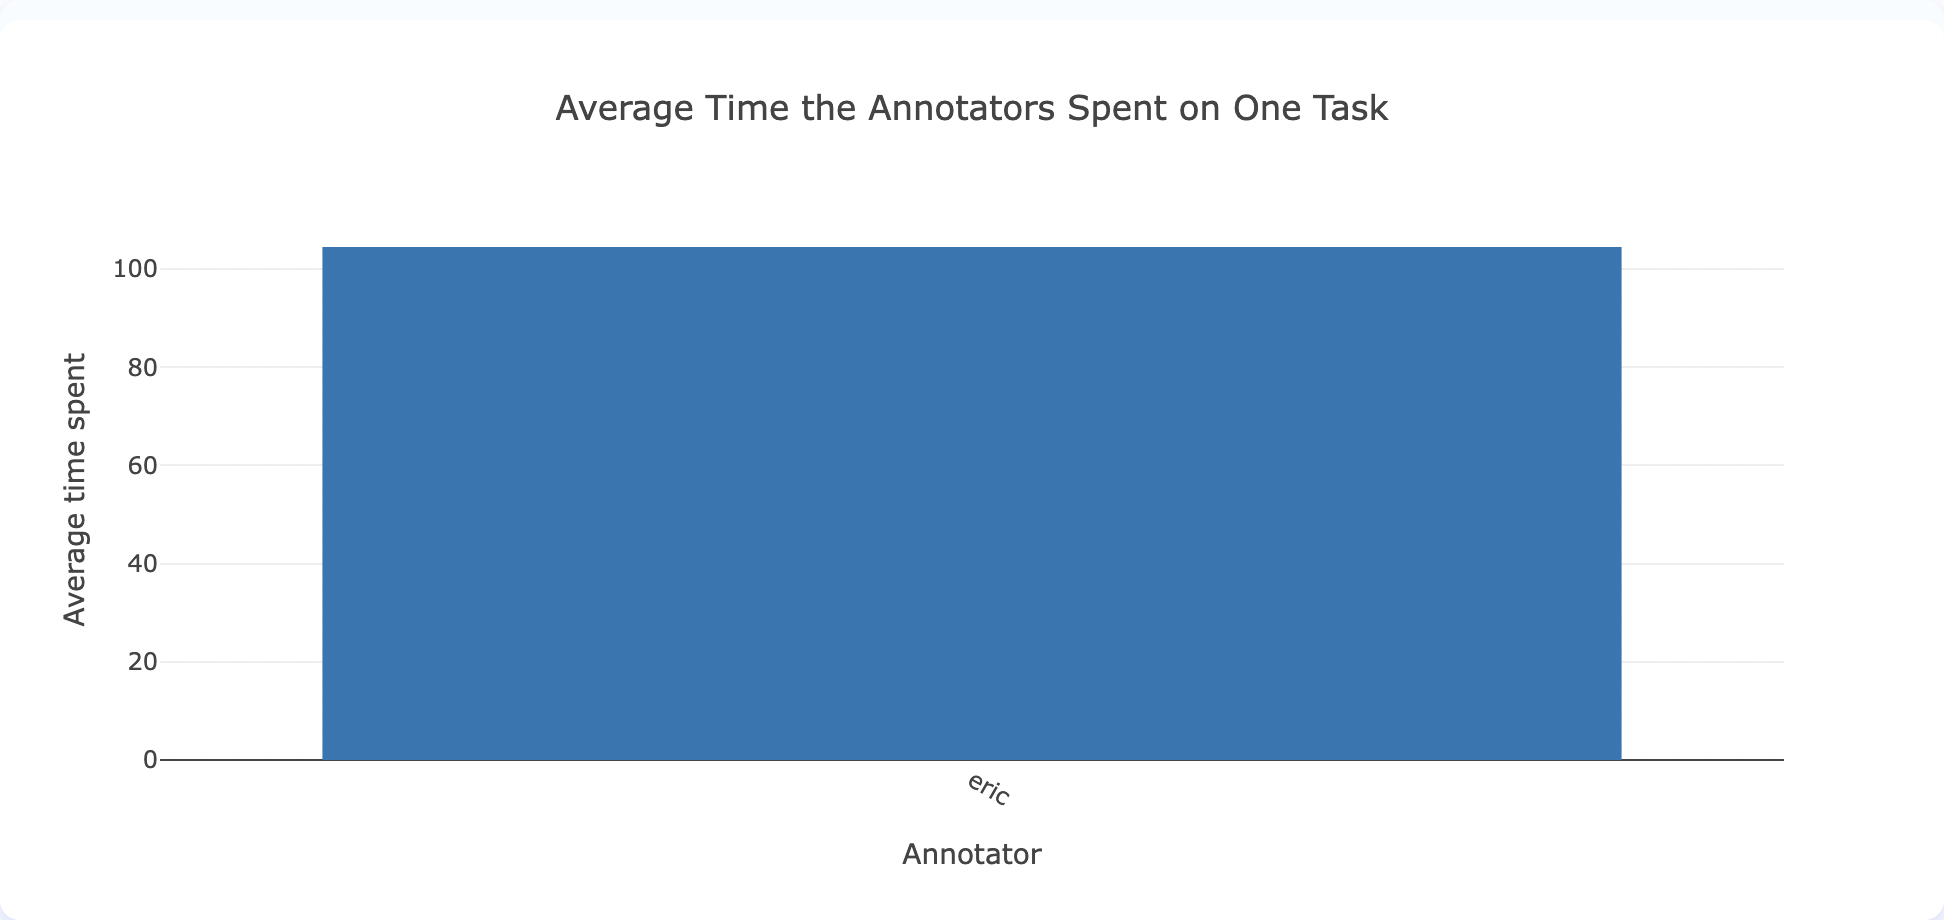
Average time spent by the Annotator in each task
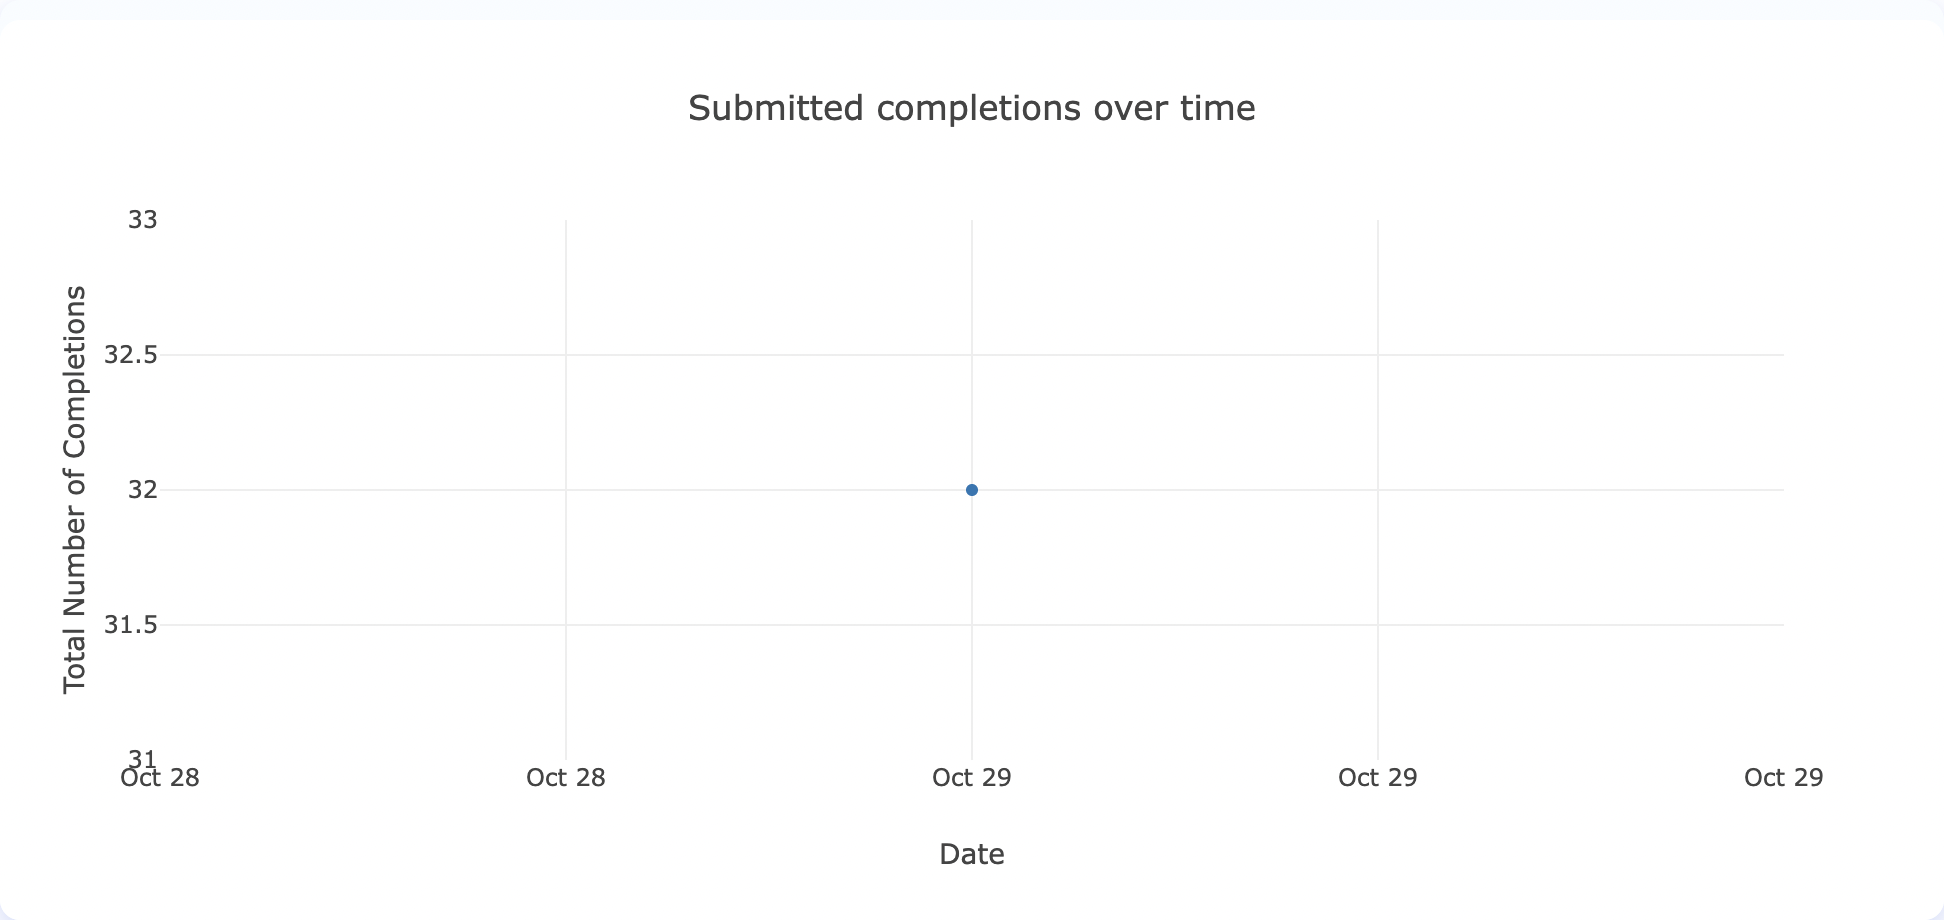
Total number of completions submitted over time
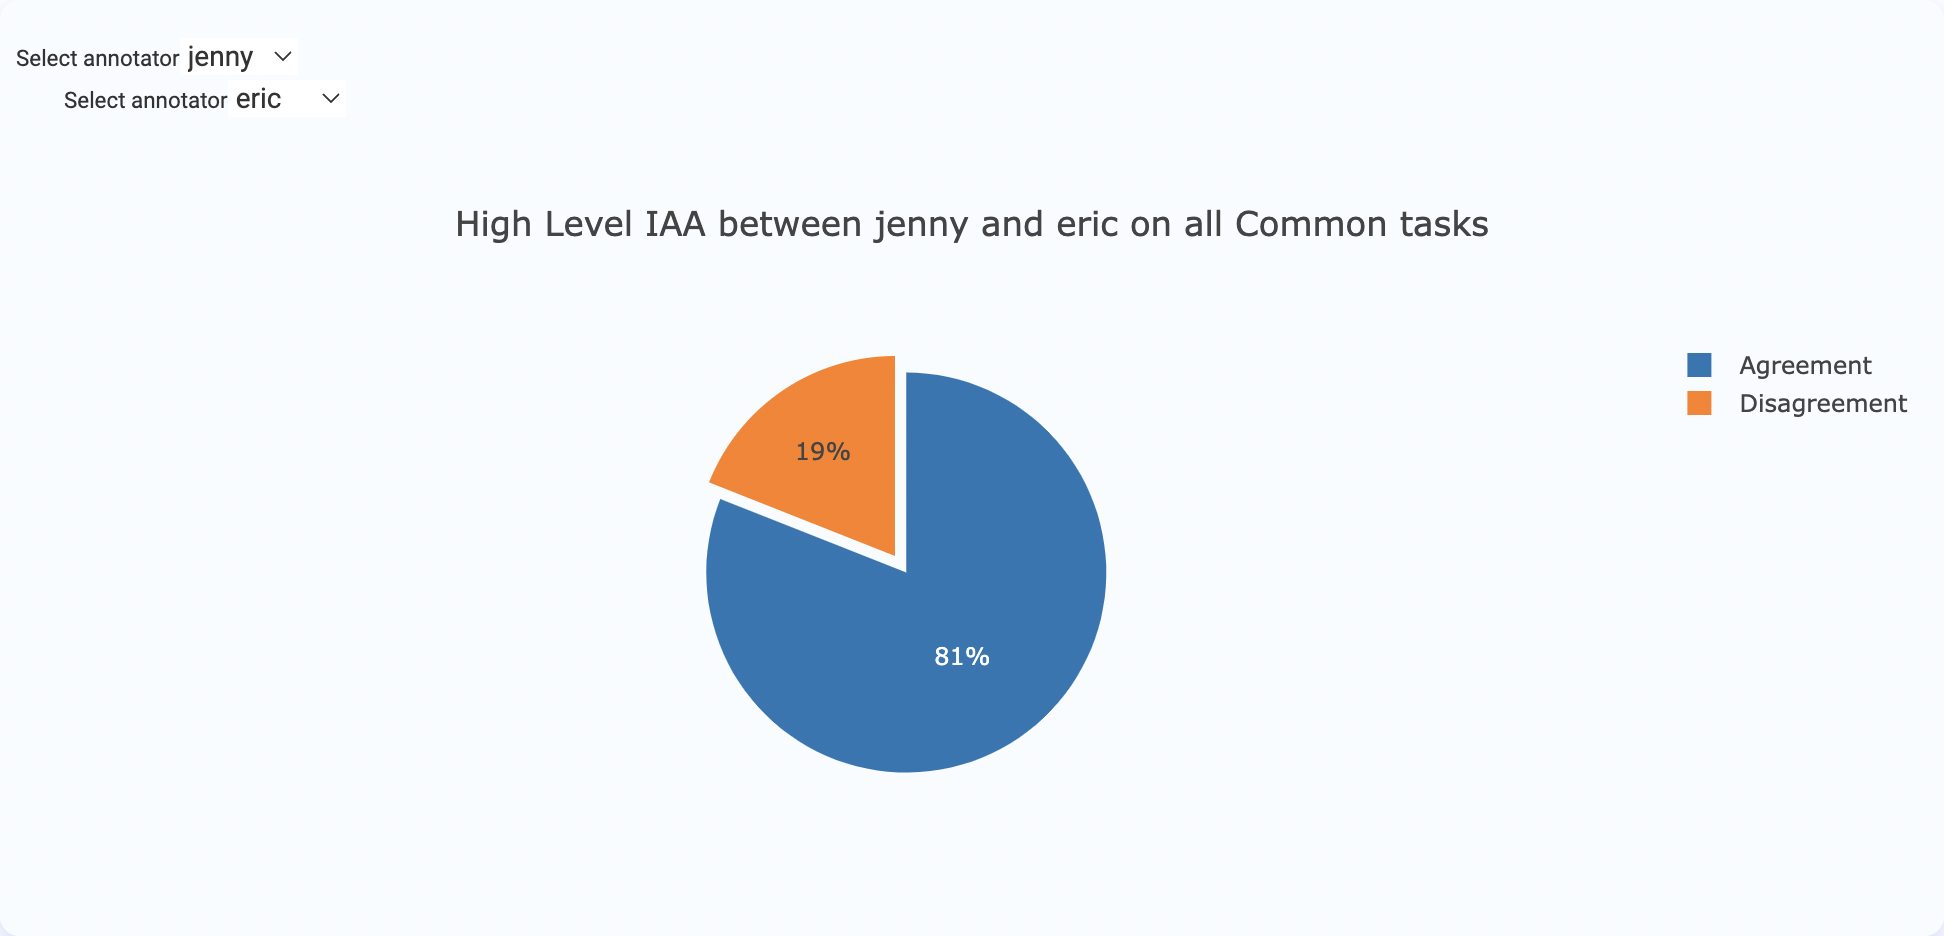
Inter-Annotator Agreement (IAA)
Inter-Annotator Agreement (IAA) charts allow teams to compare annotations produced by
IAA is available for NER projects — including those that use HTML content — so rich-text/HTML labeling workflows benefit from the same agreement metrics as plain-text projects.
Inter Annotator Agreement charts can be used by
To access IAA charts, navigate on the third tab of the
Note: Only the
Submitted andstarred (Ground Truth) completions are used to render these charts.
The following blog post explains how your team can Reach Consensus Faster by Using IAA Charts in the Generative AI Lab.
Below are the charts included in the Inter-Annotator Agreement section.
High-level IAA between annotators on all common tasks
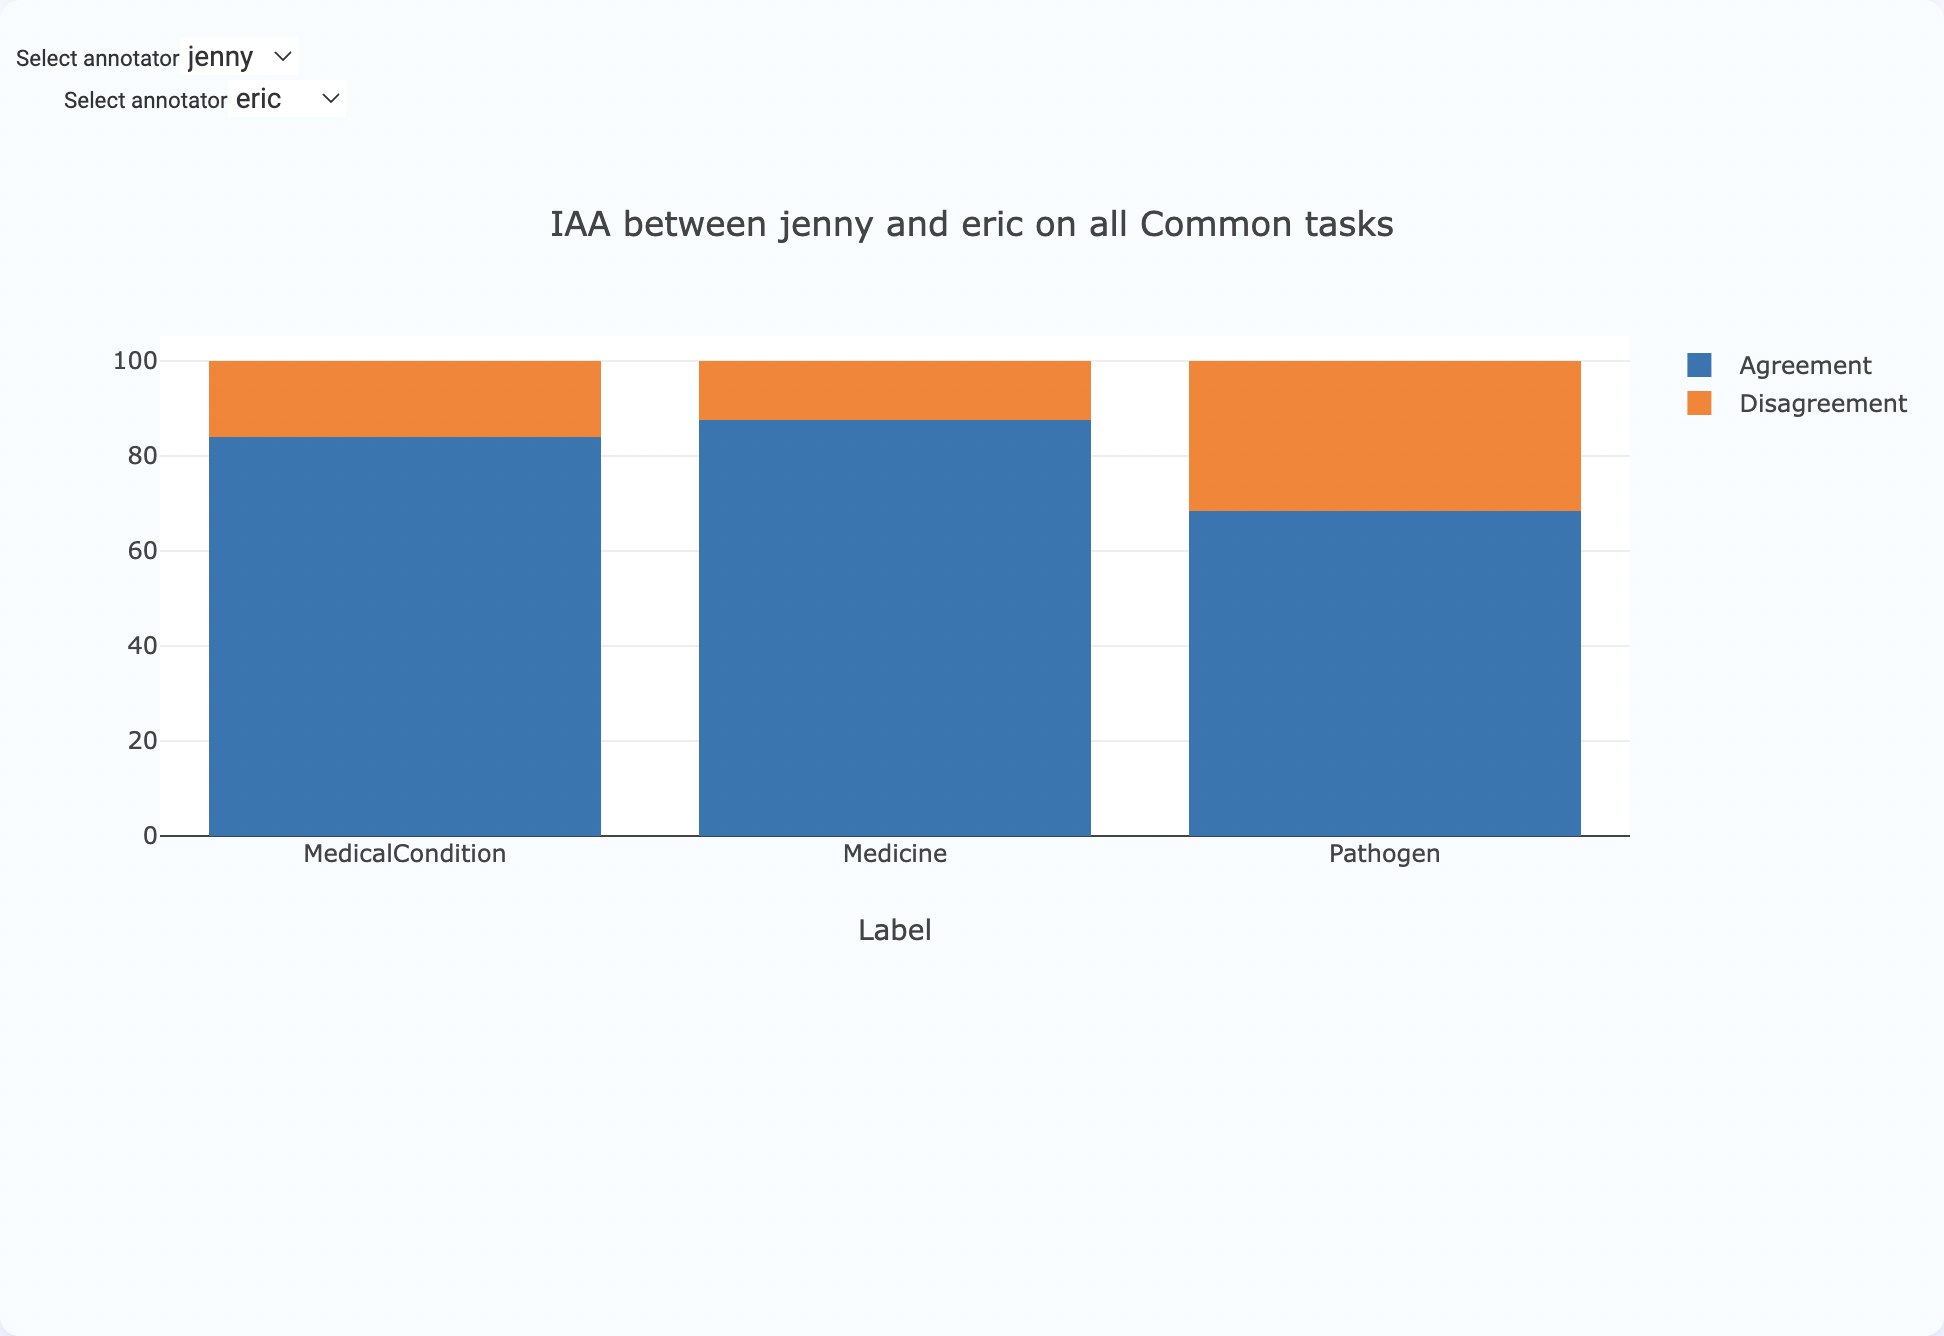
IAA between annotators for each label on all common tasks
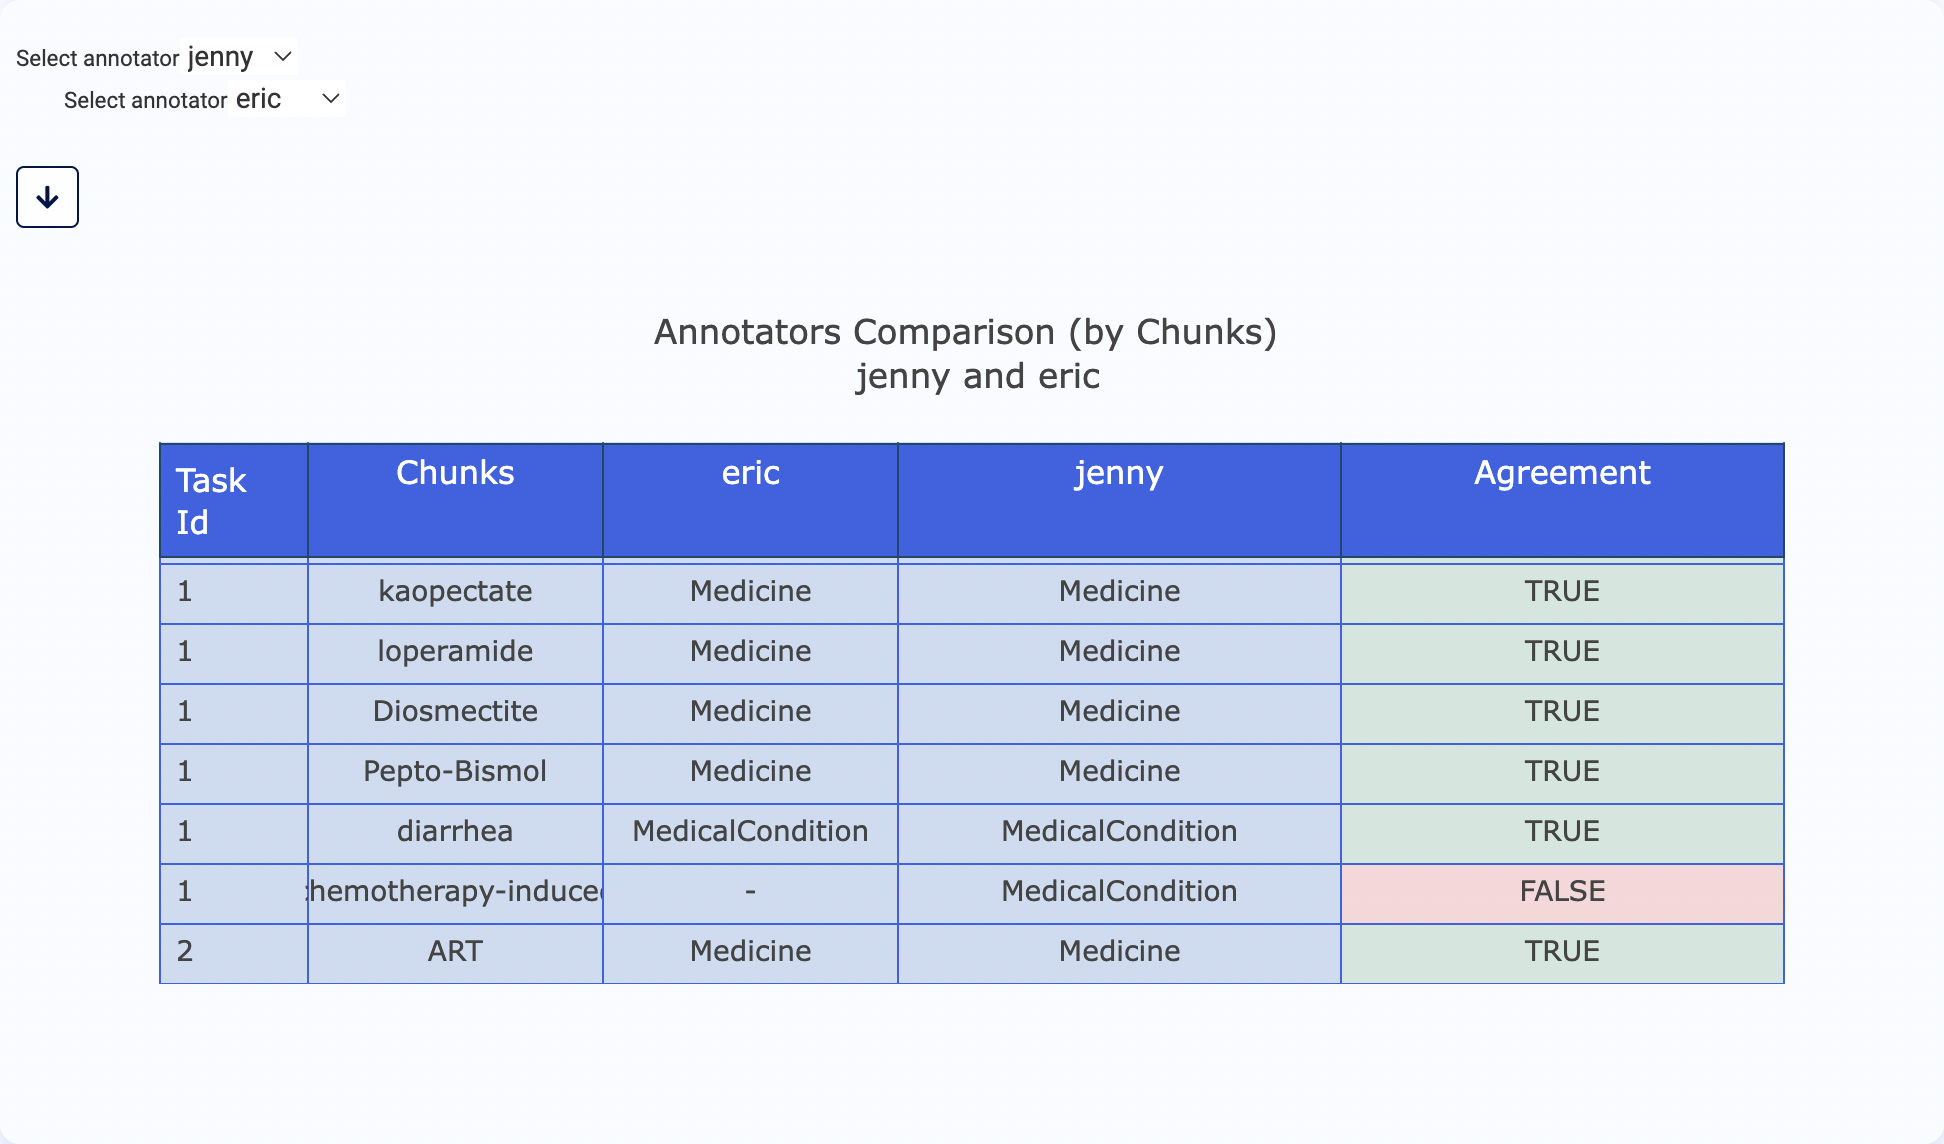
Comparison of annotations by annotator on each chunk
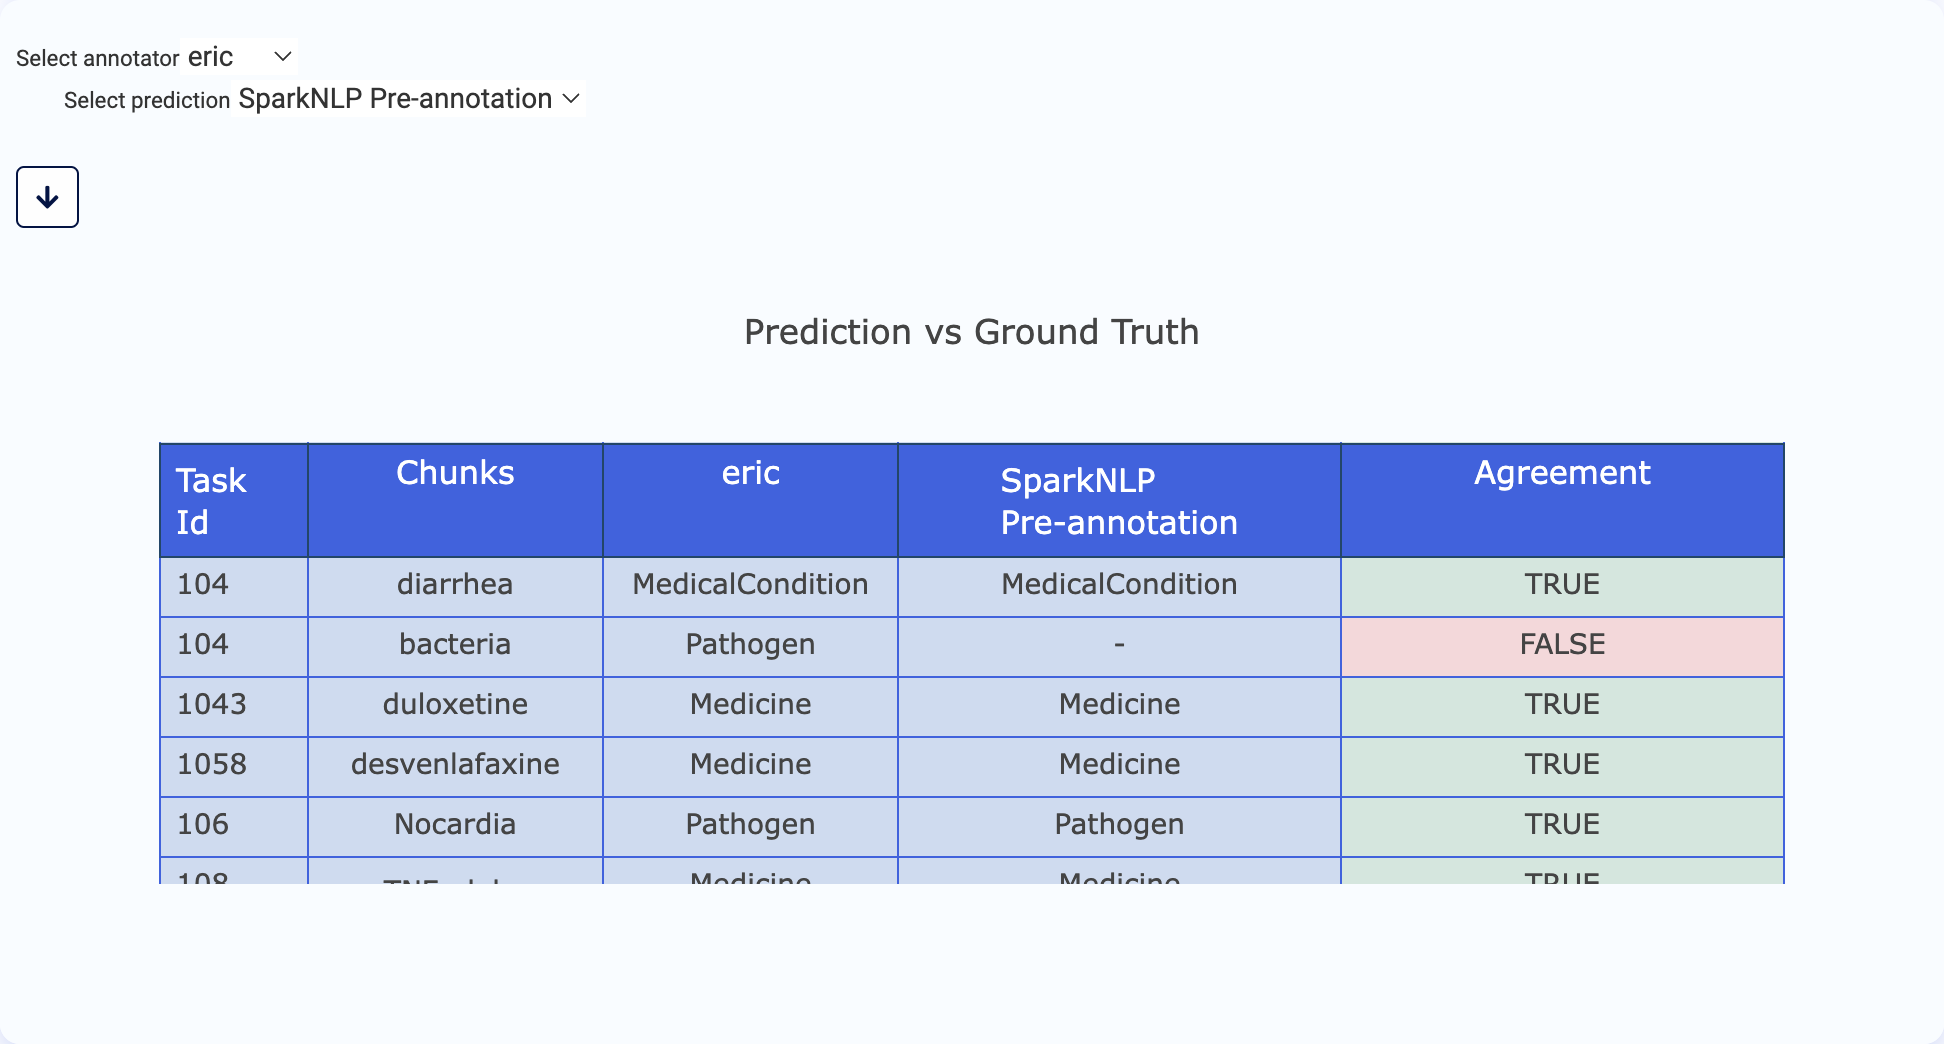
Comparison of annotations by model and annotator (Ground Truth) on each chunk
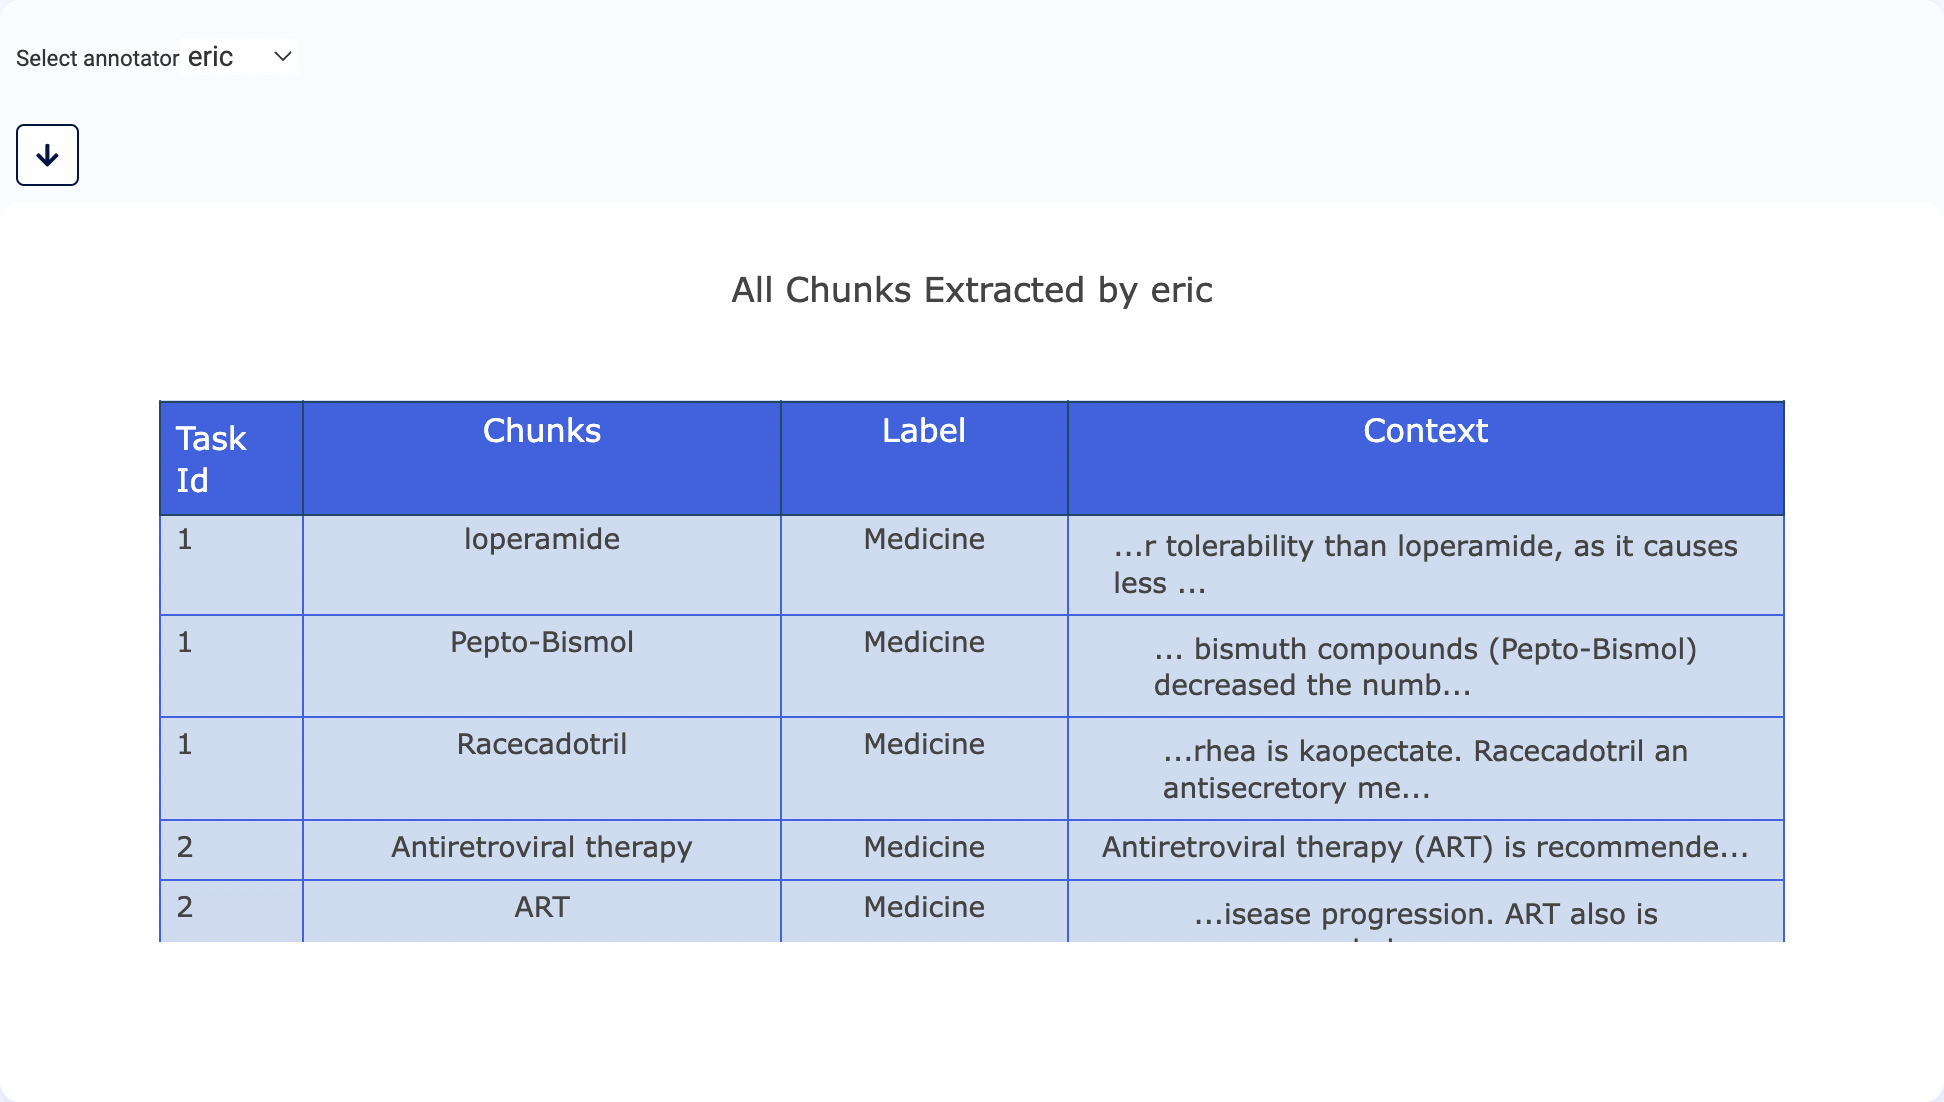
All chunks annotated by an annotator
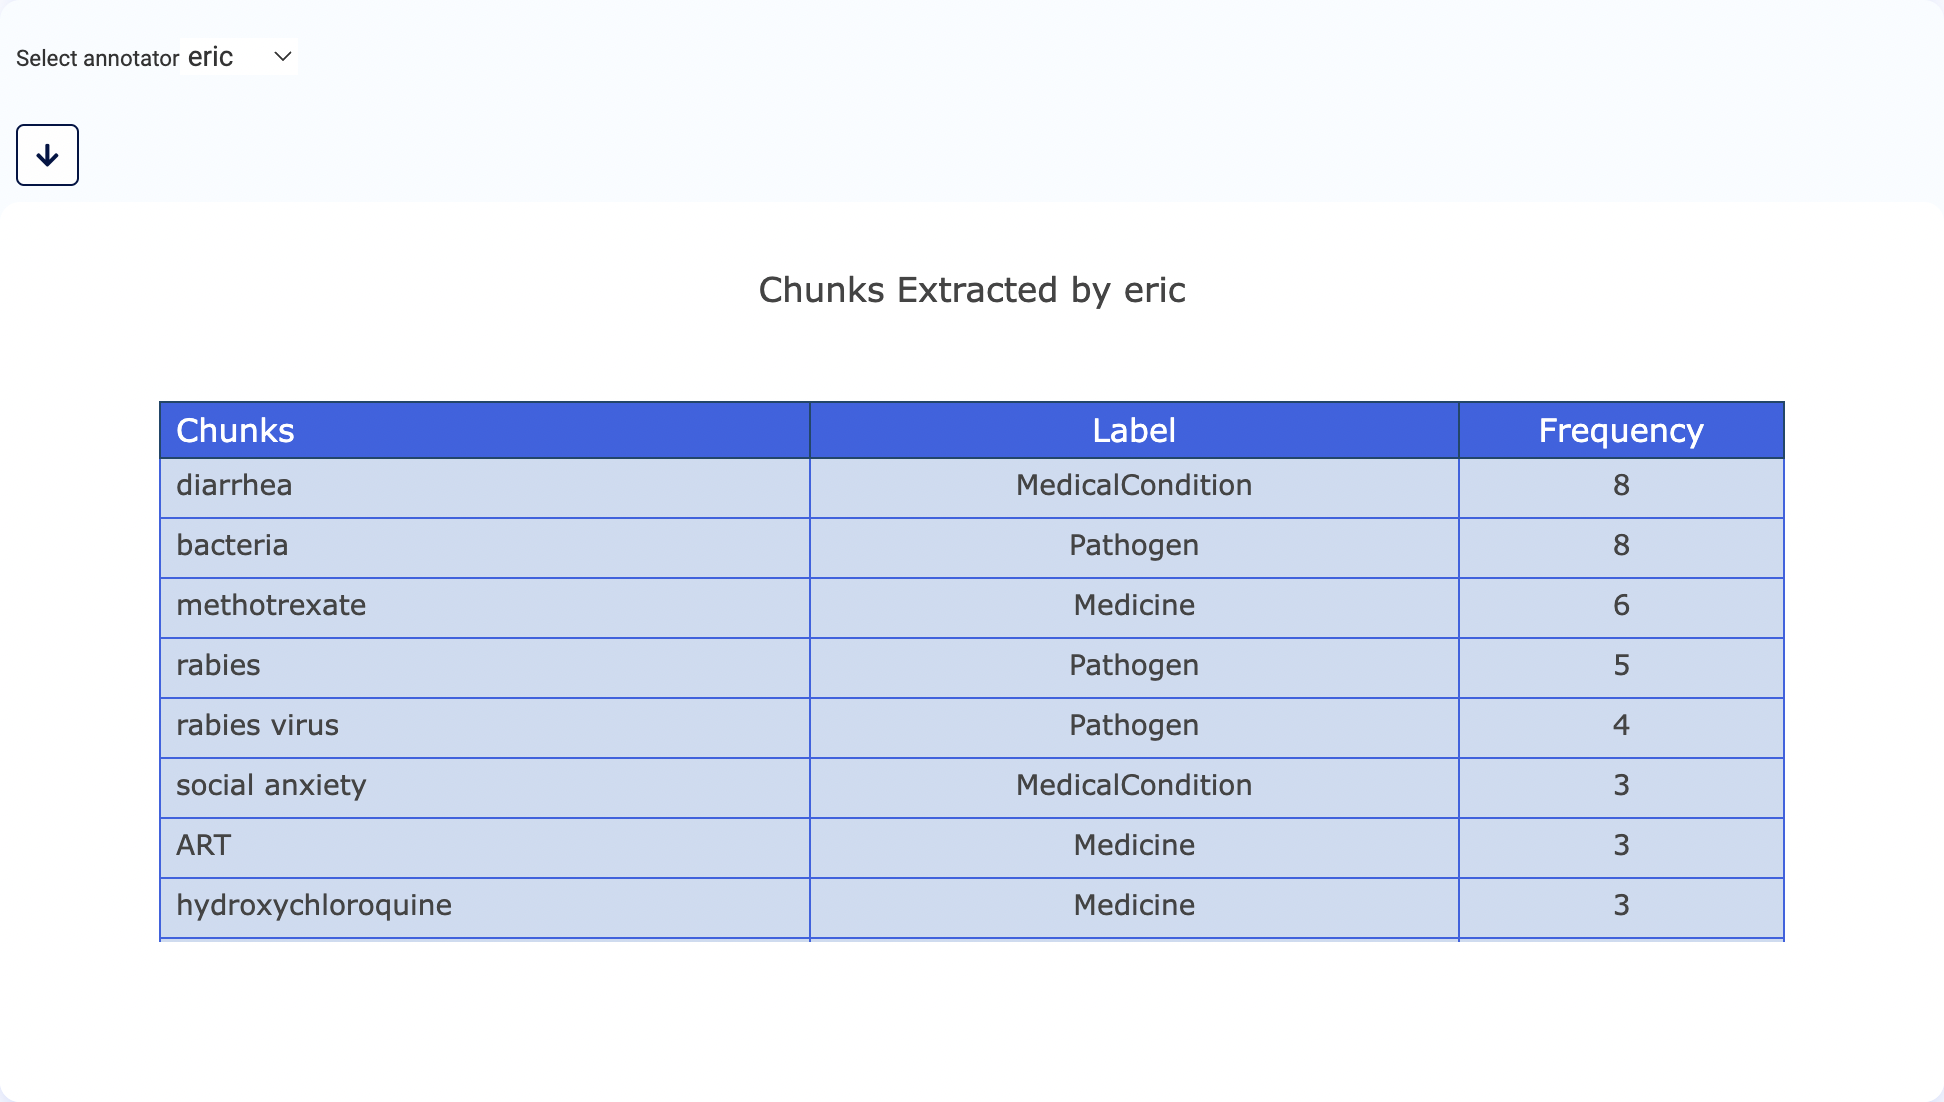
Frequency of labels on chunks annotated by an annotator
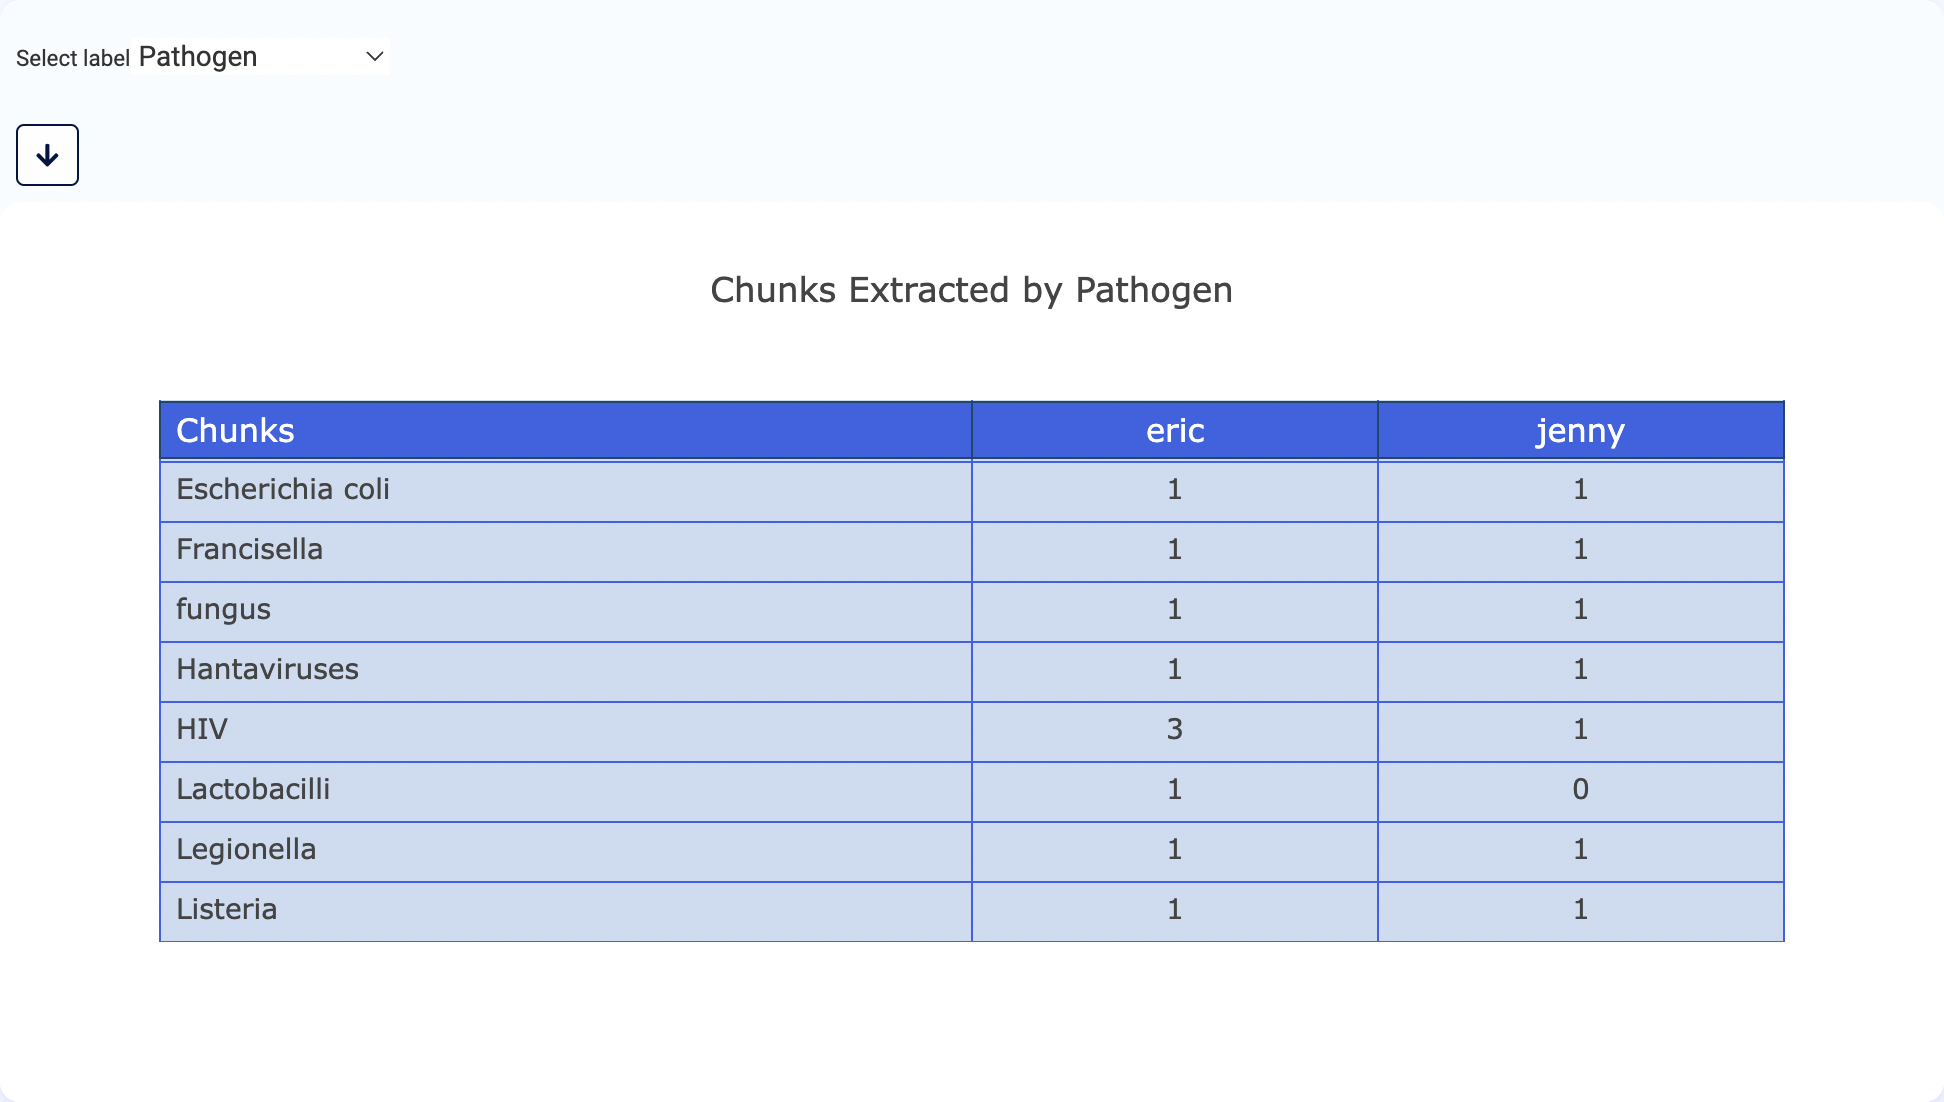
Frequency of a label on chunks annotated by each annotator
Download data used for charts
CSV file for specific charts can be downloaded using the new download button which will call specific API endpoints: /api/projects/{project_name}/charts/{chart_type}/download_csv
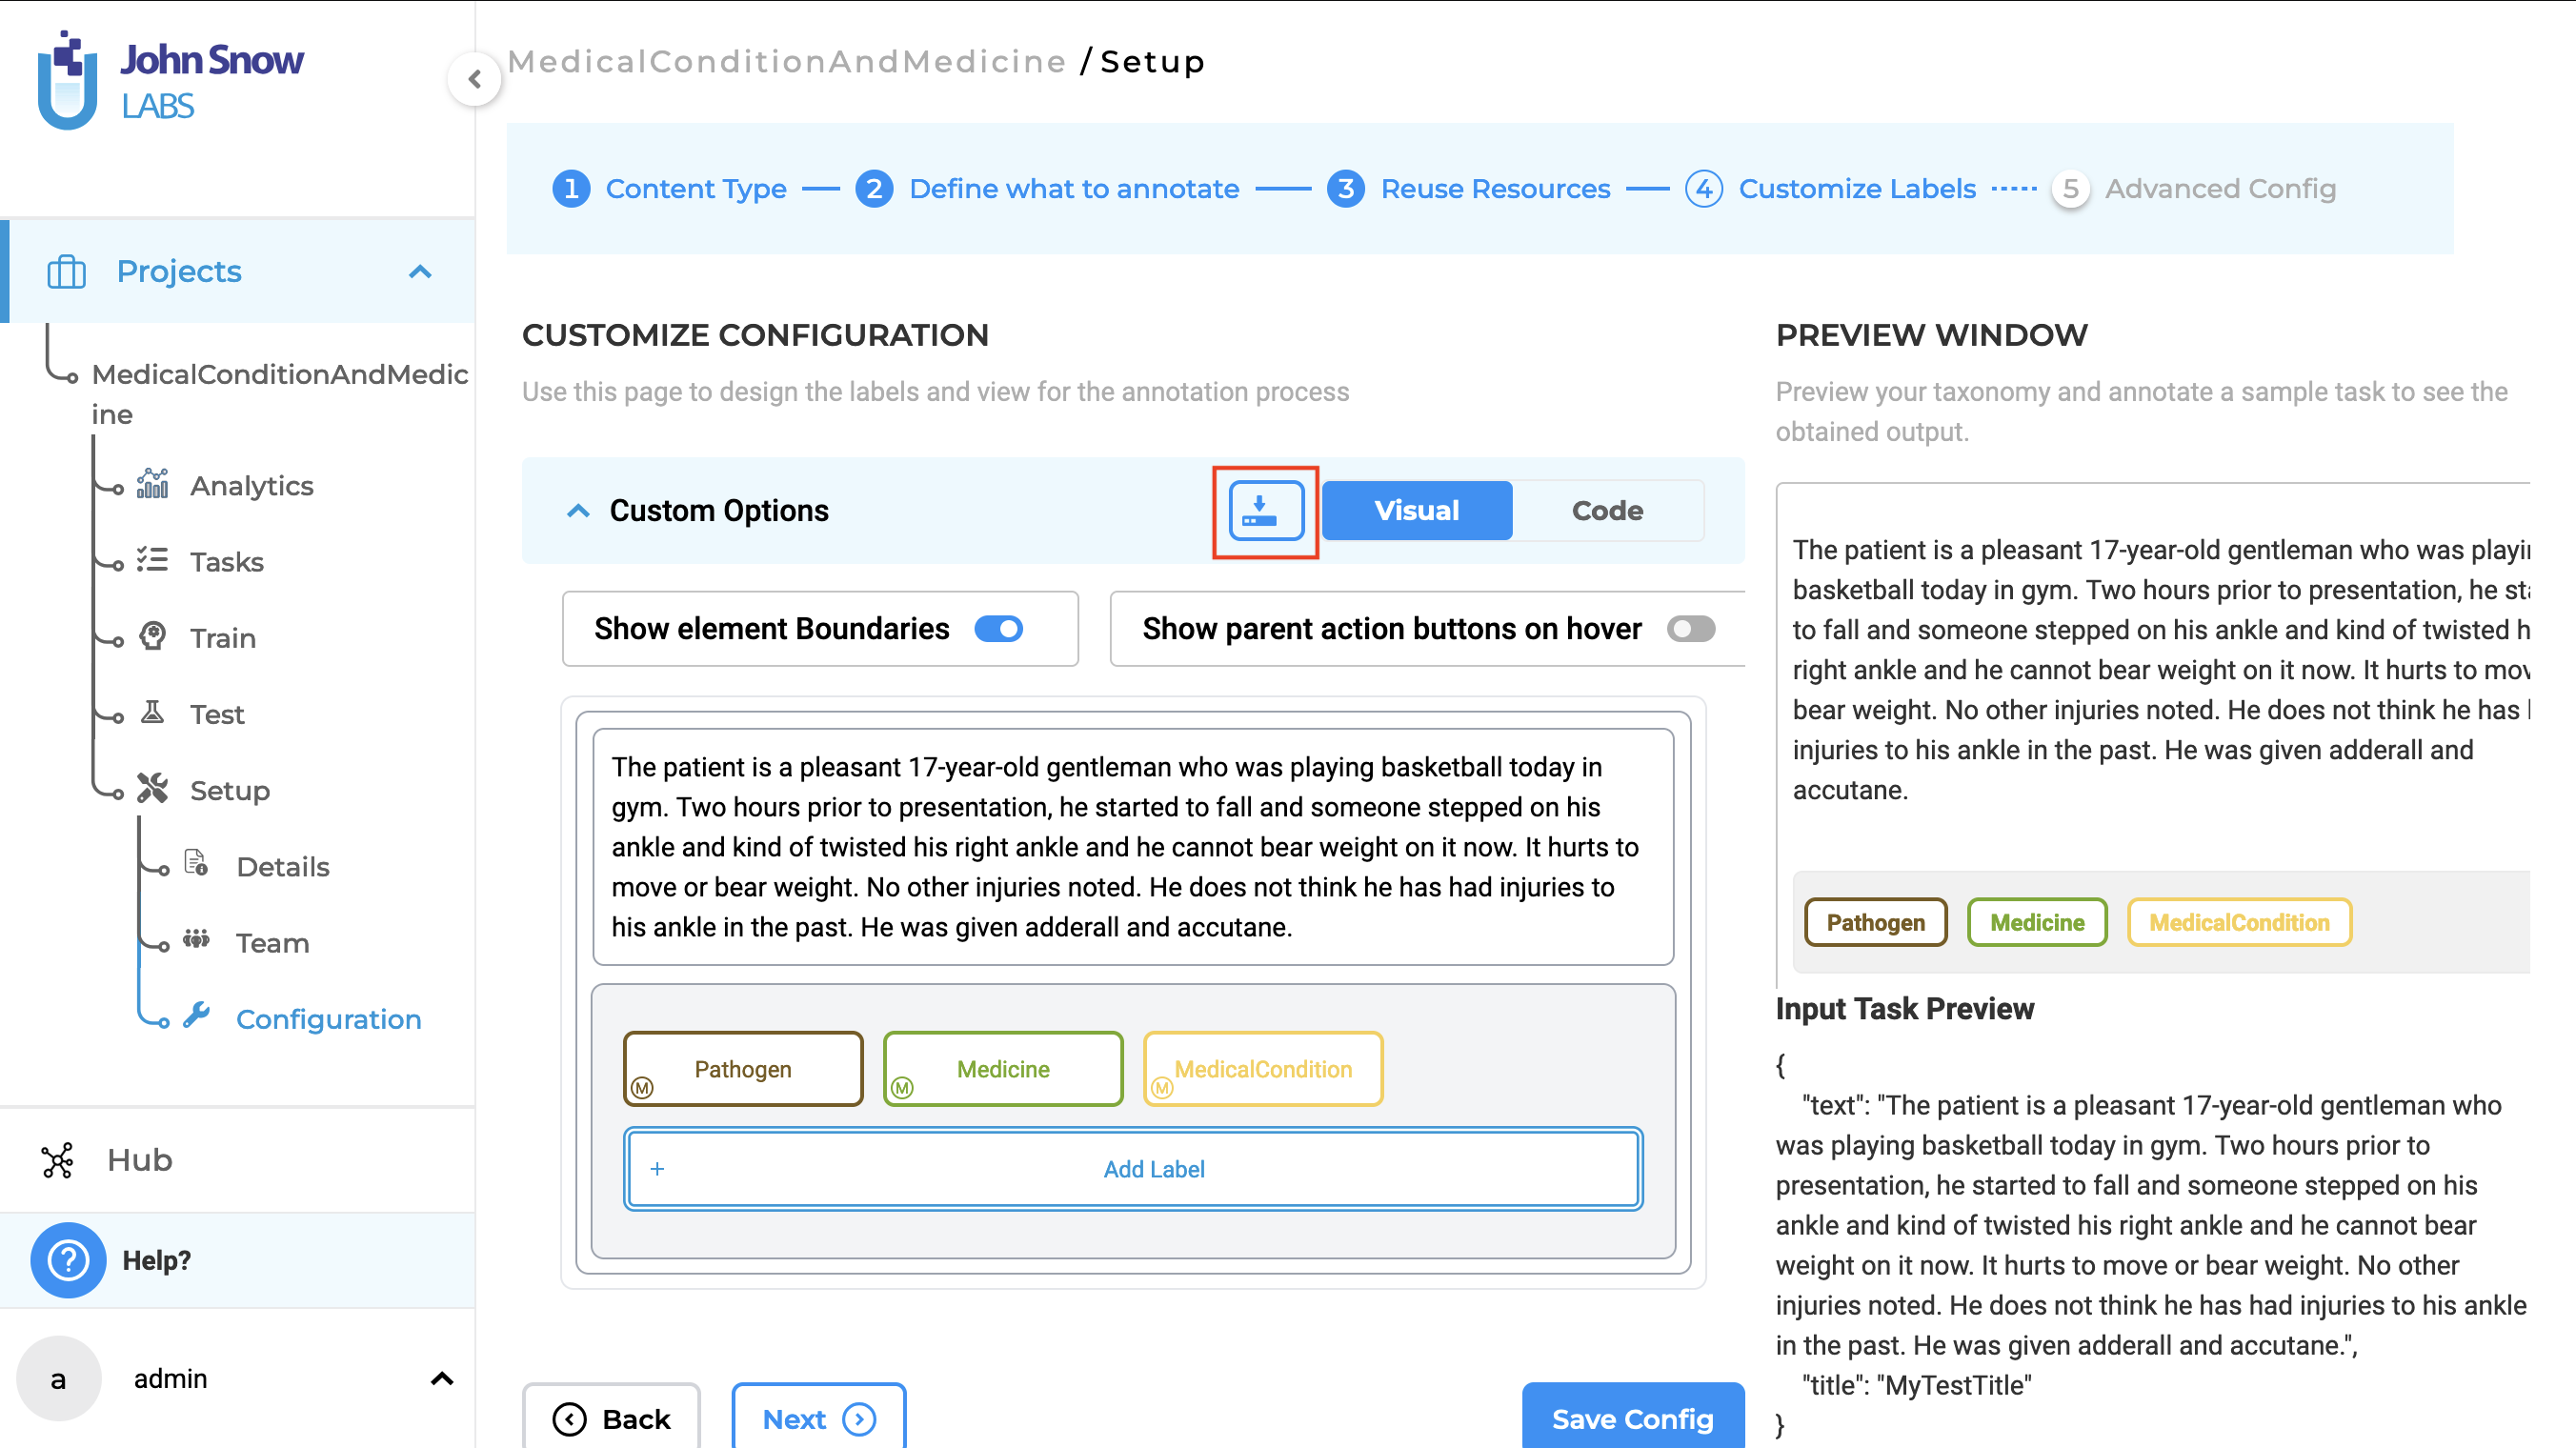
Annotation Instructions for Labels
Admin users can add annotation instructions to labels directly from the Customize Labels page during project setup.
To add annotation instructions to a label, follow these steps:
- Navigate to the
Customize Labelssection, where all your project’s labels are listed. - Click on the
Editicon next to the label for which you want to add instructions. This action will take you to theEdit Labelpage. - Enter the guidelines under the
Label Instructionsfield. - Click on
Save Labelto store the instructions. - Click on
Save Configto save the configuration.

Once annotation instructions are added, they can be viewed from the labeling page in the widget area on the right side. Users can enable or disable the annotation guidelines through the Annotation Guidelines toggle. To view the guidelines, the label must first be activated by clicking on it, which will display the label under the Annotation Guideline section. Clicking on the label text will then reveal the annotation instructions for that label.
Users with the Project Manager role can edit and delete annotation guidelines directly from the labeling page. However, users with the Annotator and Reviewer roles can only view the guidelines and do not have permission to edit or delete them.
Remove the annotation instructions from the labeling page:
Edit the annotation instructions from the Labeling page:
When multiple labels are selected, the guidelines for each label can be viewed one at a time by clicking on the corresponding label text.
Annotation guidelines can also be downloaded in JSON format by clicking on the Download icon from the Customize Labels page.
Additionally, annotation guidelines are available for Assertion Labels as well.