6.6.0
Release date: 09-25-2024
Automatic Tests for Classification Models and Results Visualization in Generative AI Lab - 6.6
Generative AI Labs version 6.6 introduces support for evaluating and testing classification models, a feature previously available only for Named Entity Recognition (NER) models. With this update, users can assess both pre-trained and custom classification models across a variety of dimensions such as Bias, Robustness, Fairness, Representation, Accuracy, and/or Grammar, ensuring their models are fit for the specificities of the target use cases.
This release also brings enhanced visualization features for Test reports. Users can now easily toggle the “Show Graph” option to visualize test outcomes as weighted bar charts that display pass and fail percentages. This feature allows users to quickly interpret test results at both high-level and detailed scales. Key parameters such as Test Categories, Test Types, Passing Rate, and Failure Rate are presented alongside the charts for comprehensive insight.
Test Classification models
Version 6.6 brings support for evaluating and testing classification models, a feature previously available only for Named Entity Recognition (NER) models, enabling users to assess the accuracy and performance of both pre-trained and custom classification models across various test types.
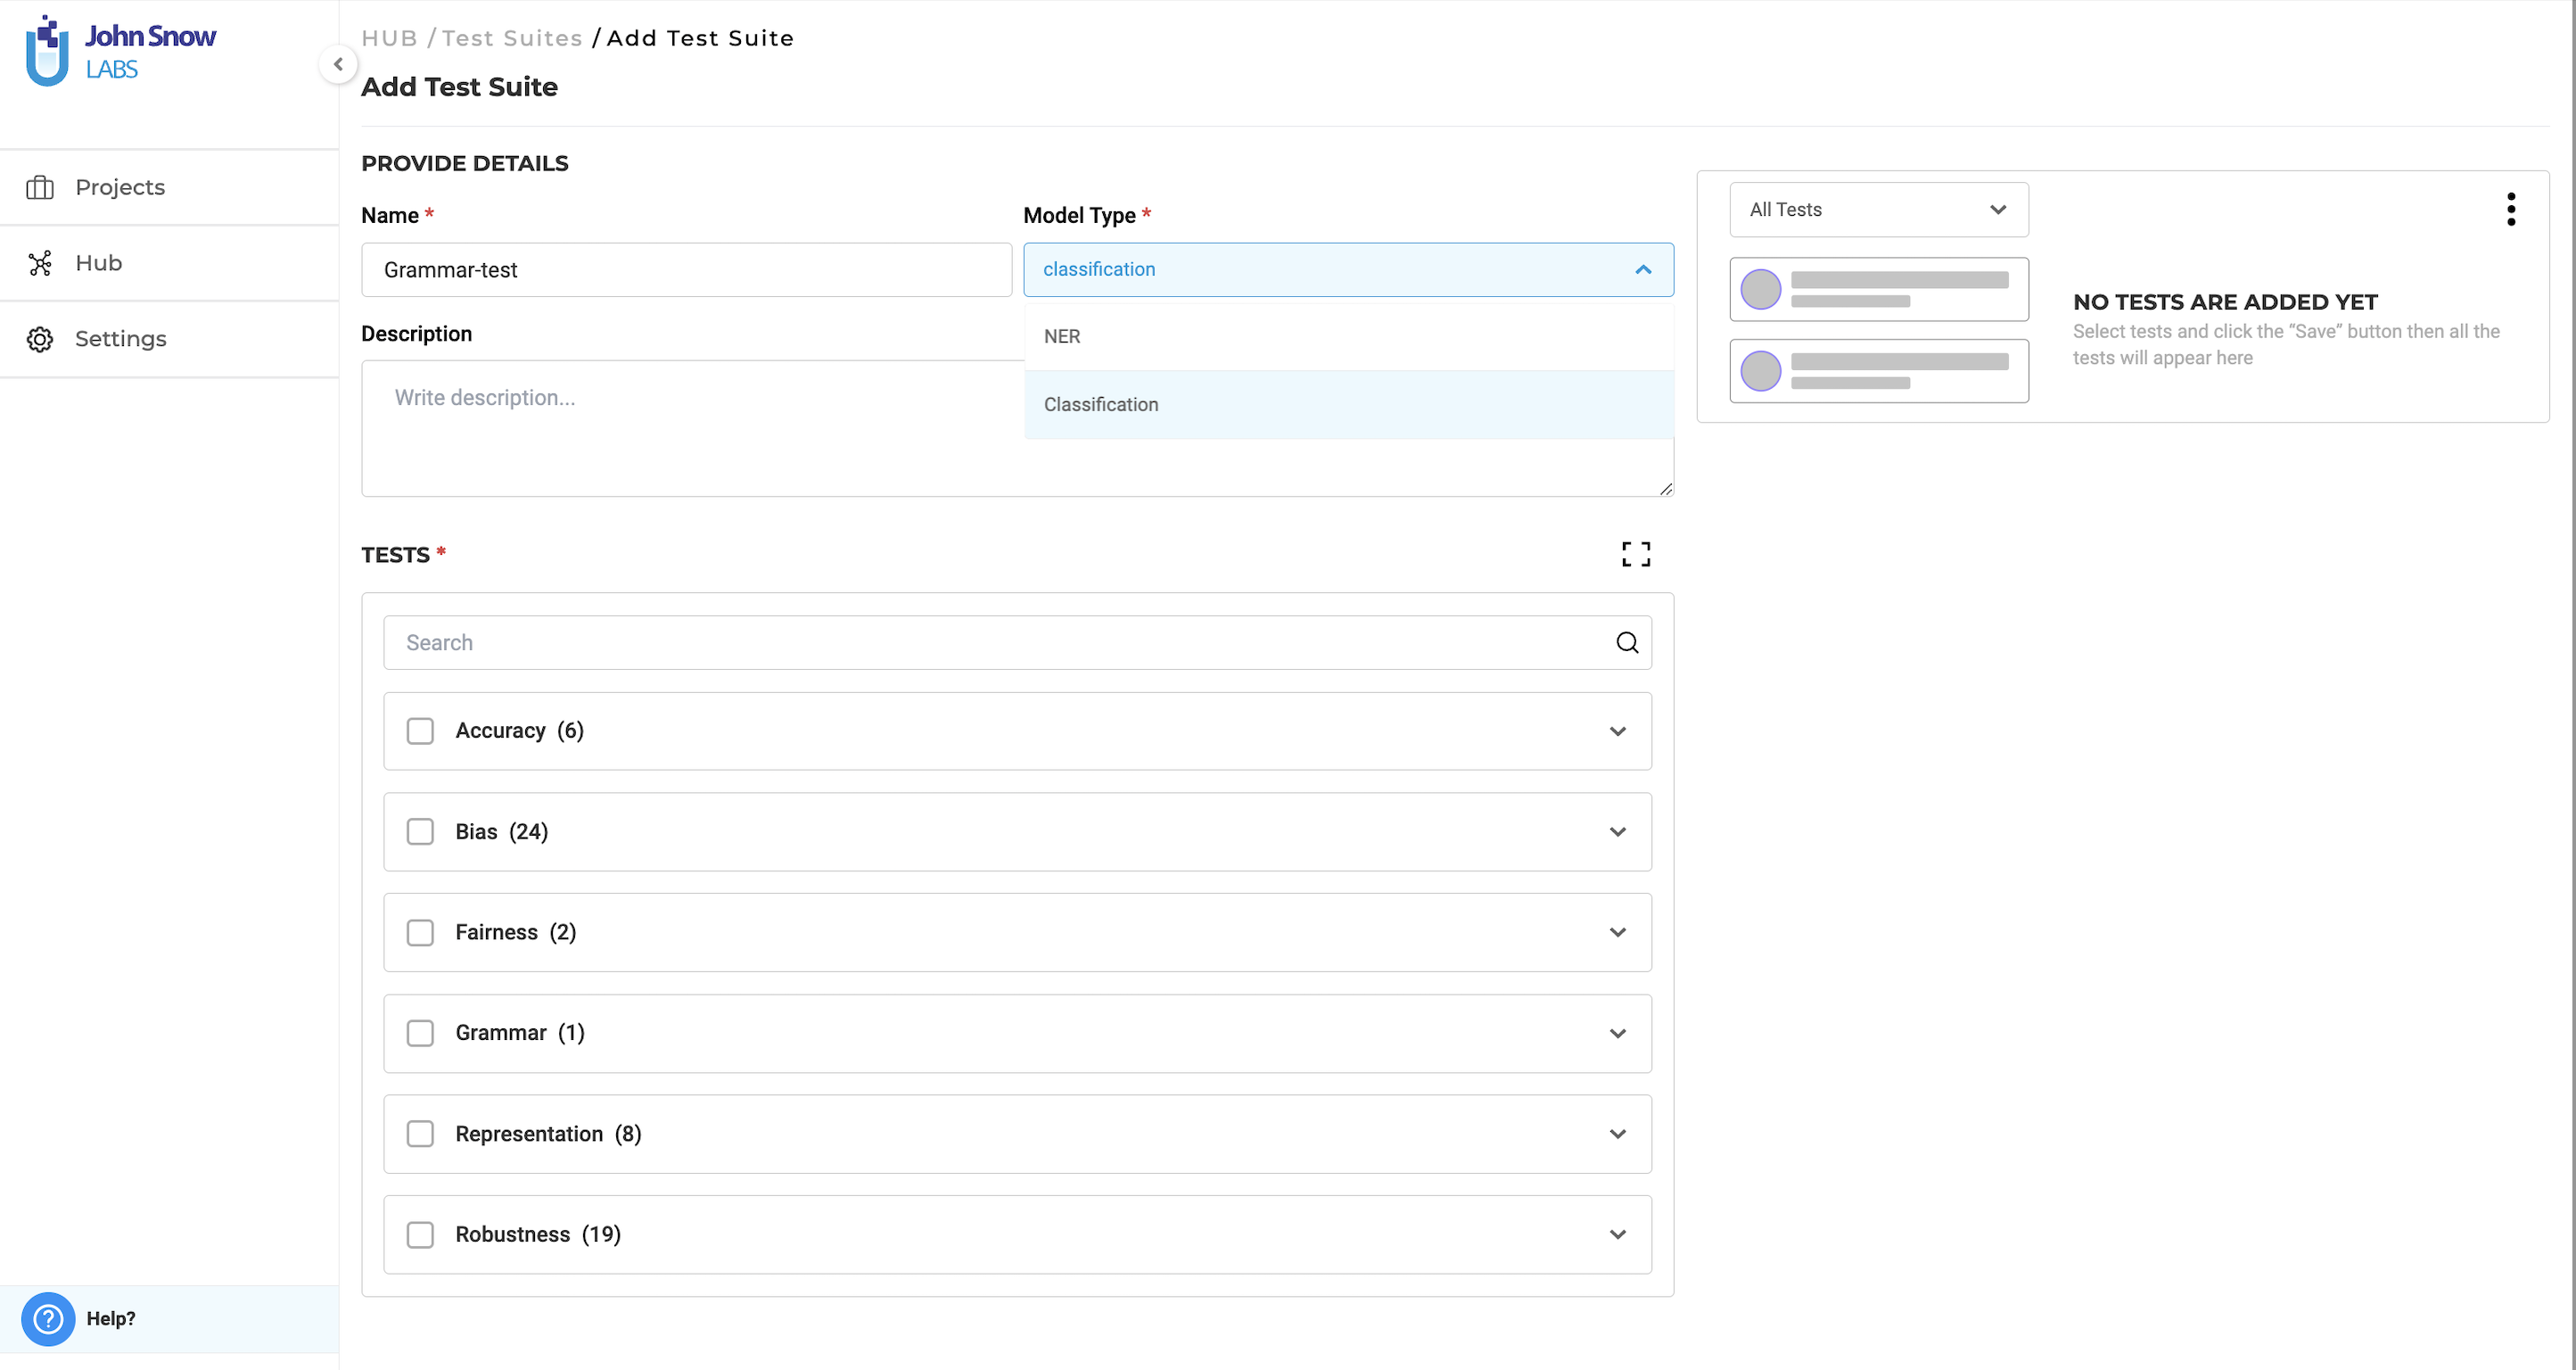
While the test types from NER model testing—such as Bias, Robustness, Fairness, Representation, and Accuracy—are still supported for classification models, a notable new addition is the ”Grammar” test. This test evaluates how well classification models handle grammatically complex or varied sentences, ensuring that the model maintains high accuracy even with challenging grammatical structures. Users need to select the model type as classification from the Model Type dropdown while creating the test suite.
Test Setup and Configuration for Classification Models
To set up and configure tests for classification models in version 6.6, follow these steps:
-
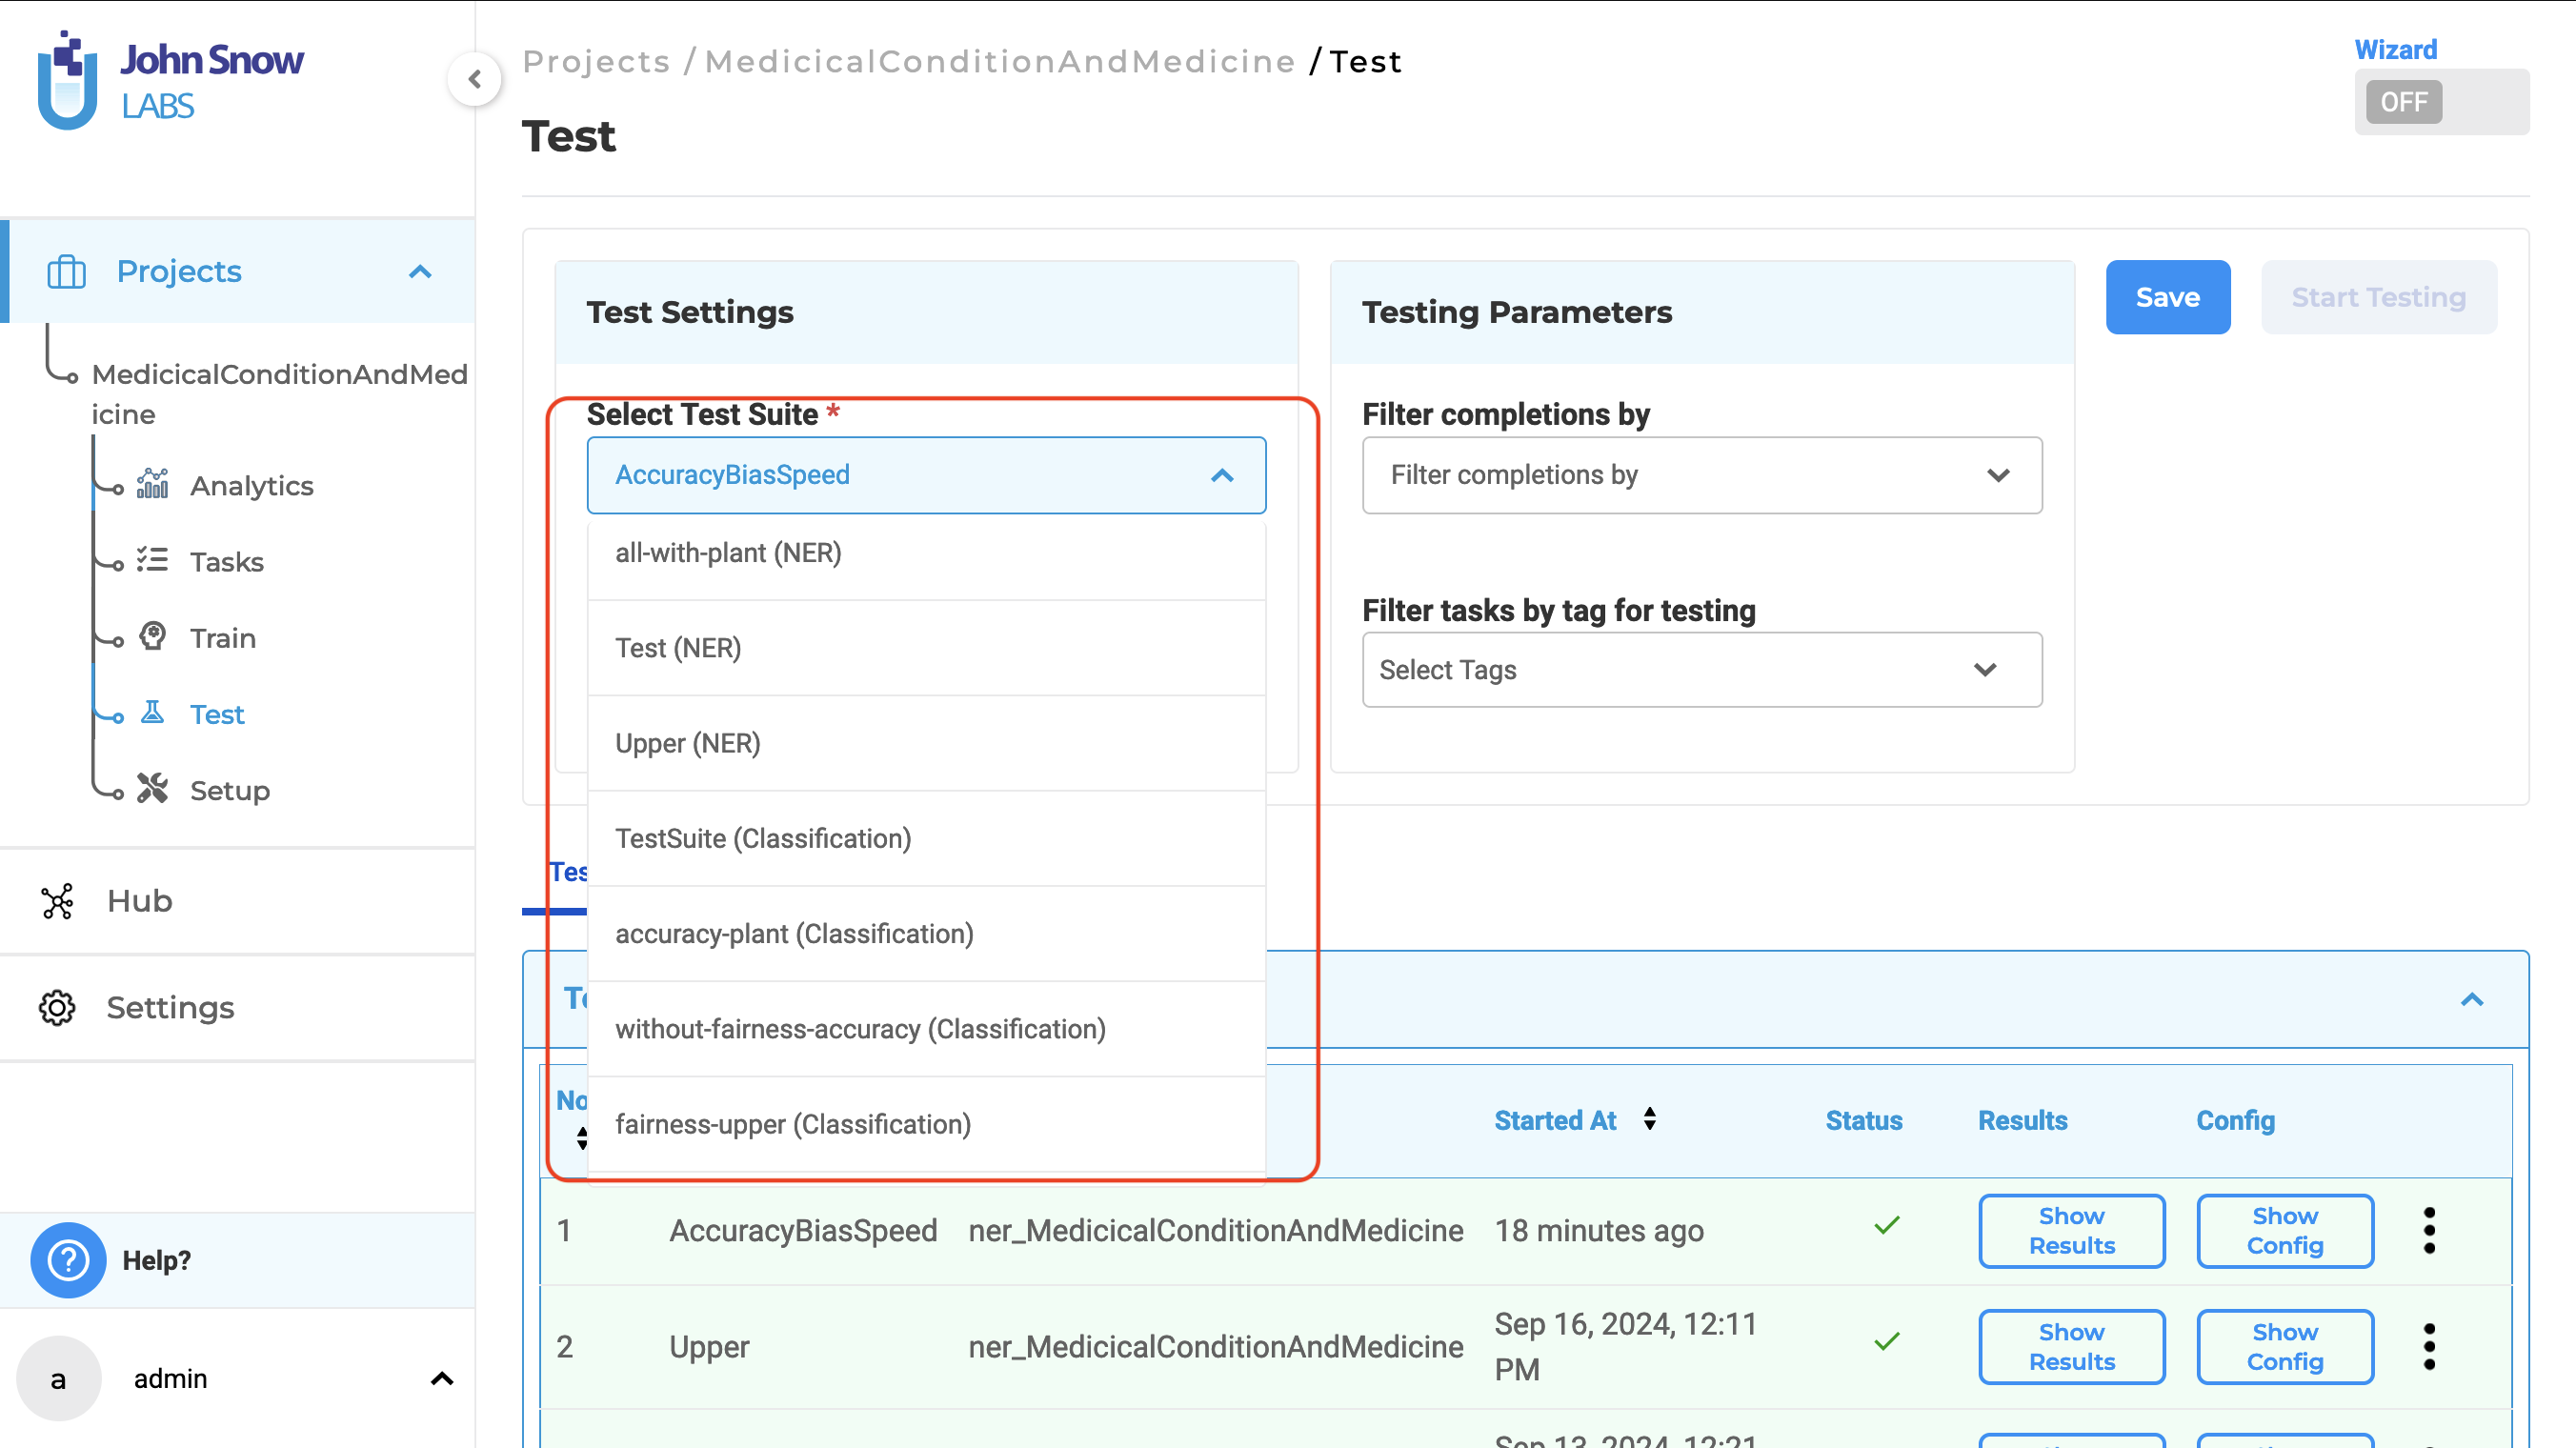
Navigate to the Test Page: Open the test page within the specific project where the model is used.
-
Select the Appropriate Test Suite: From the drop-down menu, choose the test suite for classification models. Test suites are clearly labeled with the model type in brackets, making it easy to identify the correct one.
-
Choose the Model and Target Choices: Select the classification model and the appropriate classification choices to test.
- Configure Additional Testing Parameters (optional):
- Set the “Filter Completions By” option if we need to narrow down specific completions for testing.
- Apply the “Filter Tasks by Tags for Testing” to run the tests on tasks with specific tags.
-
Save the Configuration: Once the settings are complete, save the configuration.
-
Generate Test Cases: After configuring the test, we can generate test cases based on the saved settings.
- Run the Test: Execute the tests and evaluate the classification model.
While the core workflow of the application and feature remains the same, users now have the ability to test classification models, allowing them to pinpoint potential issues and improve model performance without the need to develop custom testing solutions.
Visualizing Test Reports
Generative AI Lab 6.6 brings enhanced visualization support for test reports, offering users an intuitive way to assess test results at both high-level and granular views. By toggling the “Show Graph” option on, users can visualize test outcomes through a weighted bar chart displaying the pass and fail percentages. This graphical representation simplifies the interpretation of the test report, providing a quick overview of overall test performance. Other parameters such as Test Categories, Test Types, Passing Rate, and Failure Rate are available next to the graph. If you want to hide the charts, Show Graph option can be toggled off.
Once enabled, the graph visualizes data for all test categories and associated test types in the report. The chart’s pass and fail percentages and counts are computed based on the number of test types that passed or failed within each test category. Hovering over any segment of the chart allows users to see detailed statistics, including the pass and fail counts and their corresponding percentages.
Clicking on a chart bar or a specific test category navigates users to a more detailed view of that category and its test types. This drill-down capability allows users to move from a high-level summary to an in-depth examination of each test category, offering a more comprehensive understanding of where issues lie or where tests are performing well.

The users can apply the filters on the graph based on the test category and the test types.
This visualization tool streamlines the process of analyzing test results, providing both high-level summaries and detailed breakdowns to assist in better decision-making and problem identification.
Improvements
Improvements for Model Testing
- Clicking on the “Show Config” button, users can see the configuration applied to generate the results of the Lang test. The user can filter the test types based on the category as well in the configuration. To hide the configuration, simply click the X (close) button.
- Users can filter generated test cases and reports by both test category and test type. By default, all test categories are selected. To customize the view, users first select a test category, which then displays the associated test types, or they can then choose individual test types within a category.
- Filters On Test Cases View:
Filter On Test report:
-
The speed test type in the performance test category, designed for NER models, now supports positive float values. Previously, it only accepted positive integers.
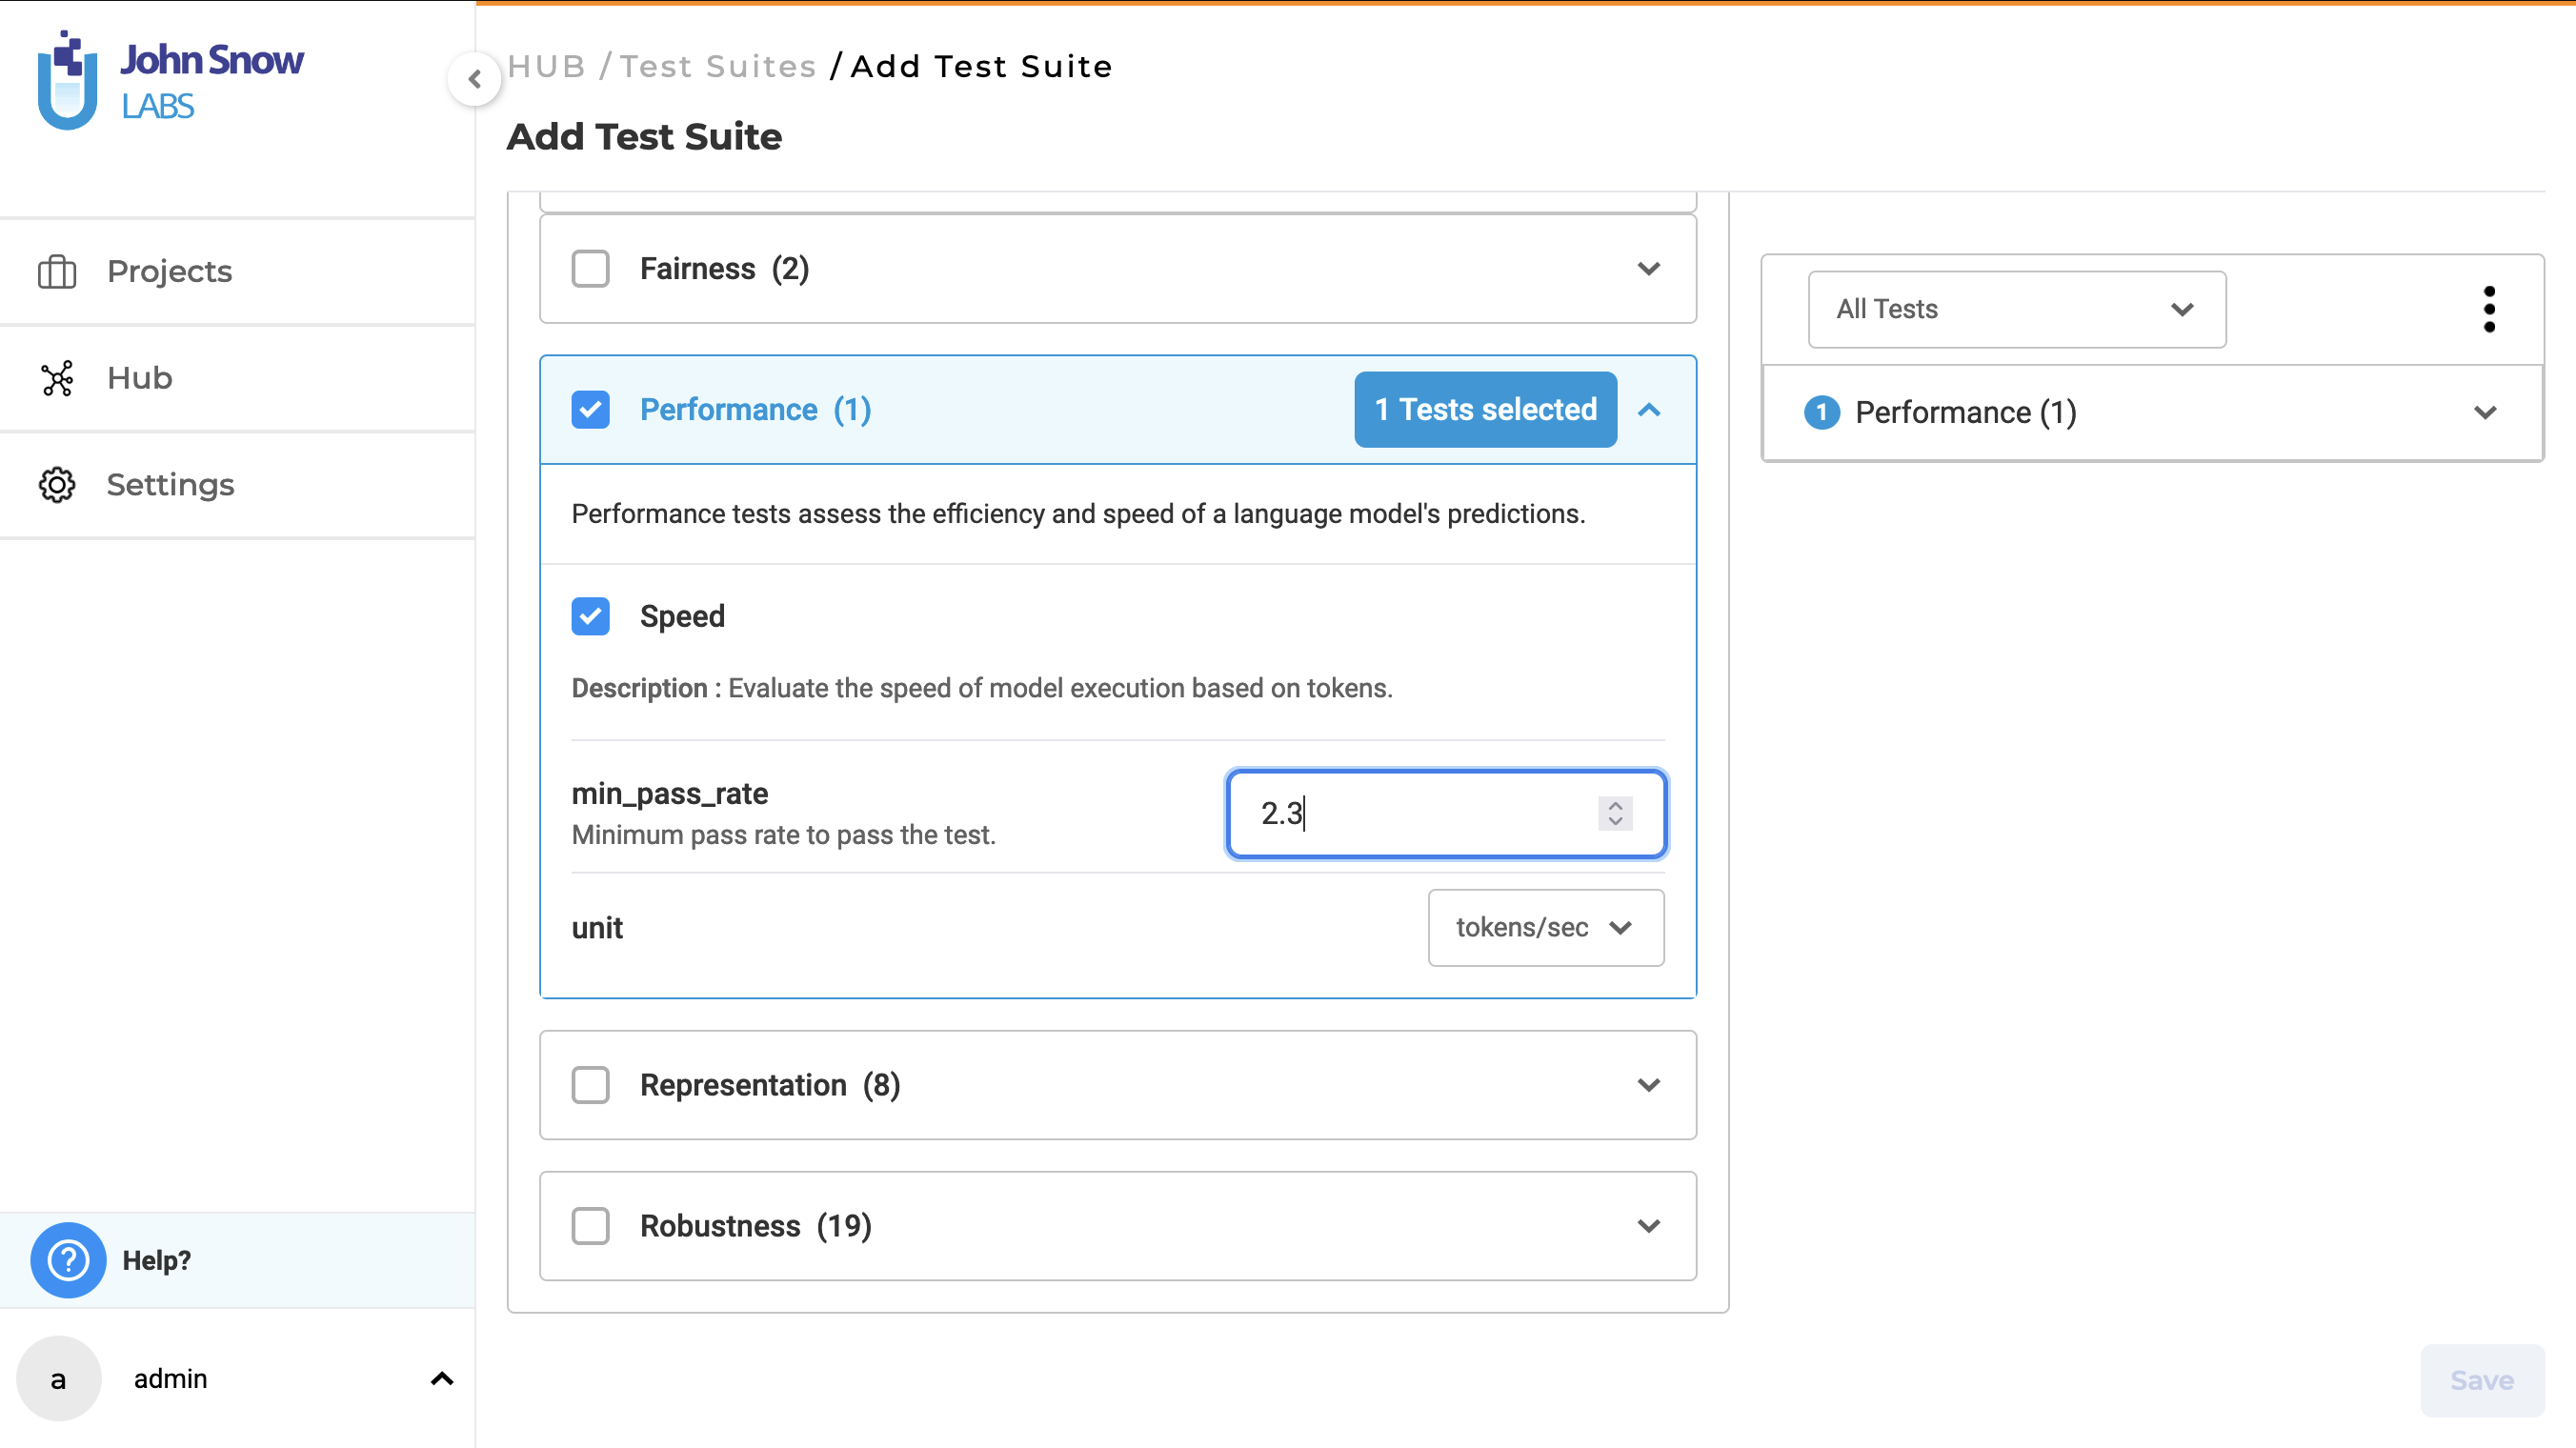
-
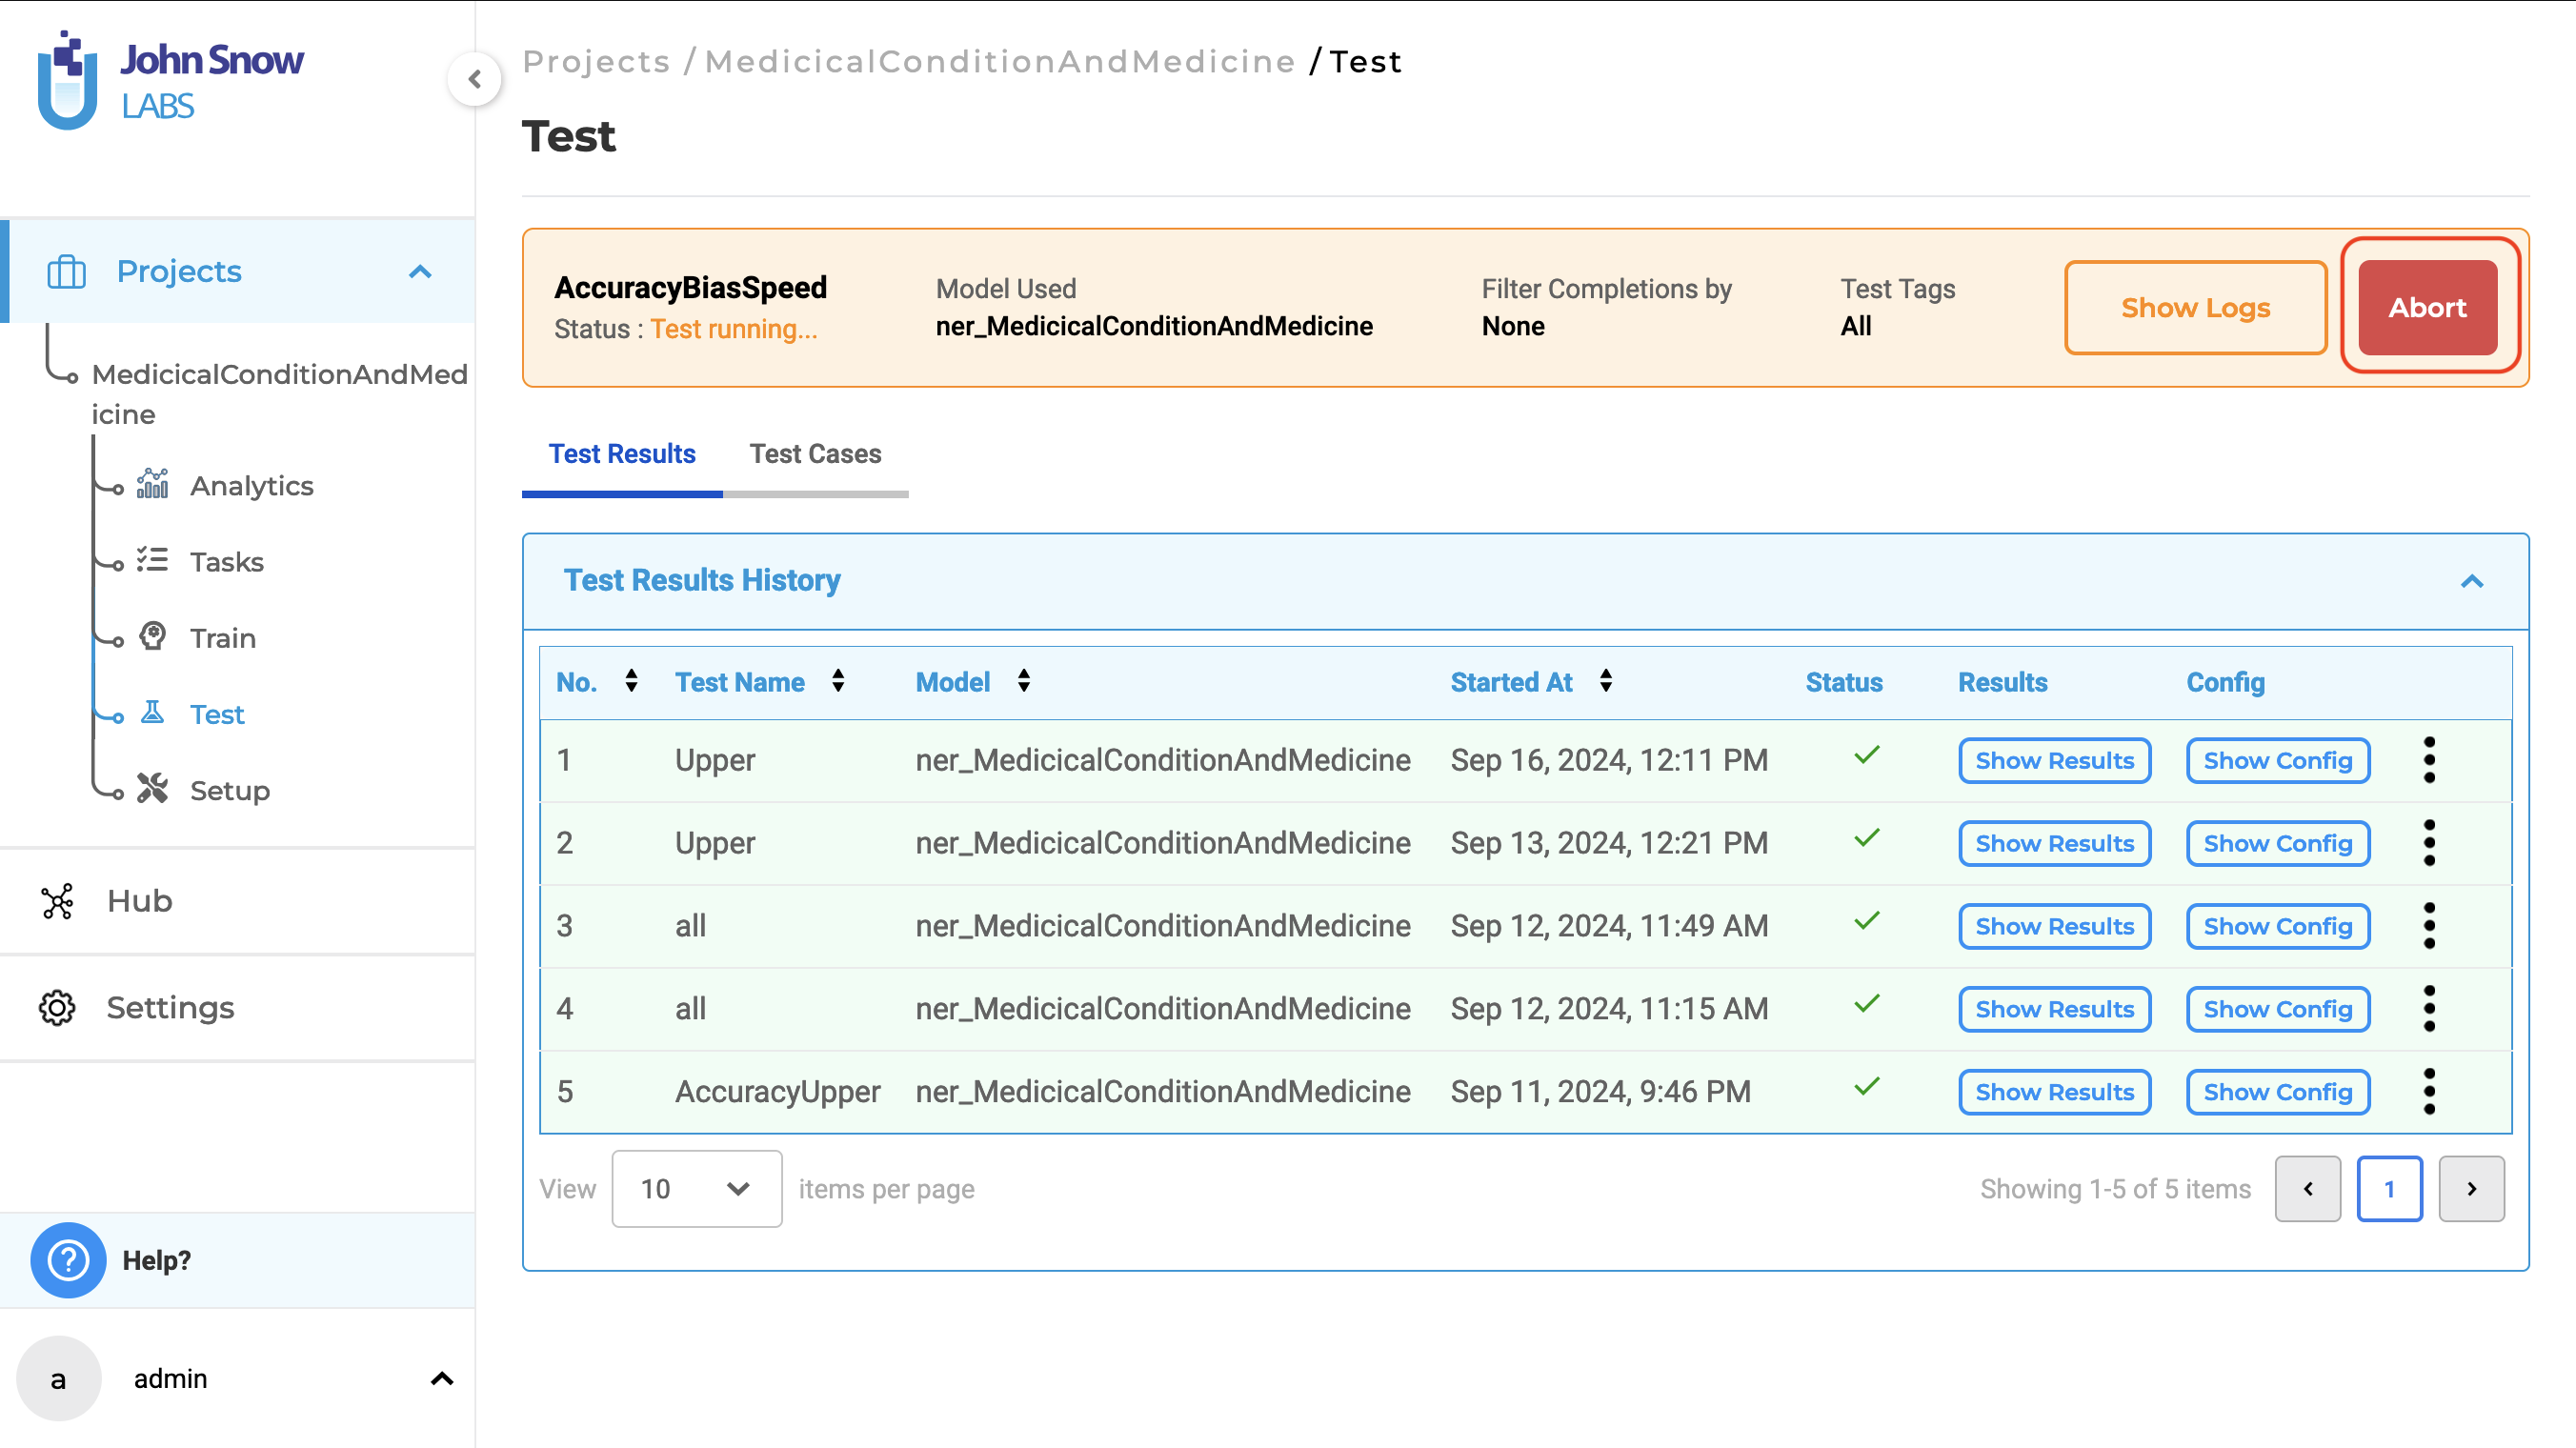
The Stop button has been renamed to Abort for both test case generation and model testing. Test case generation:
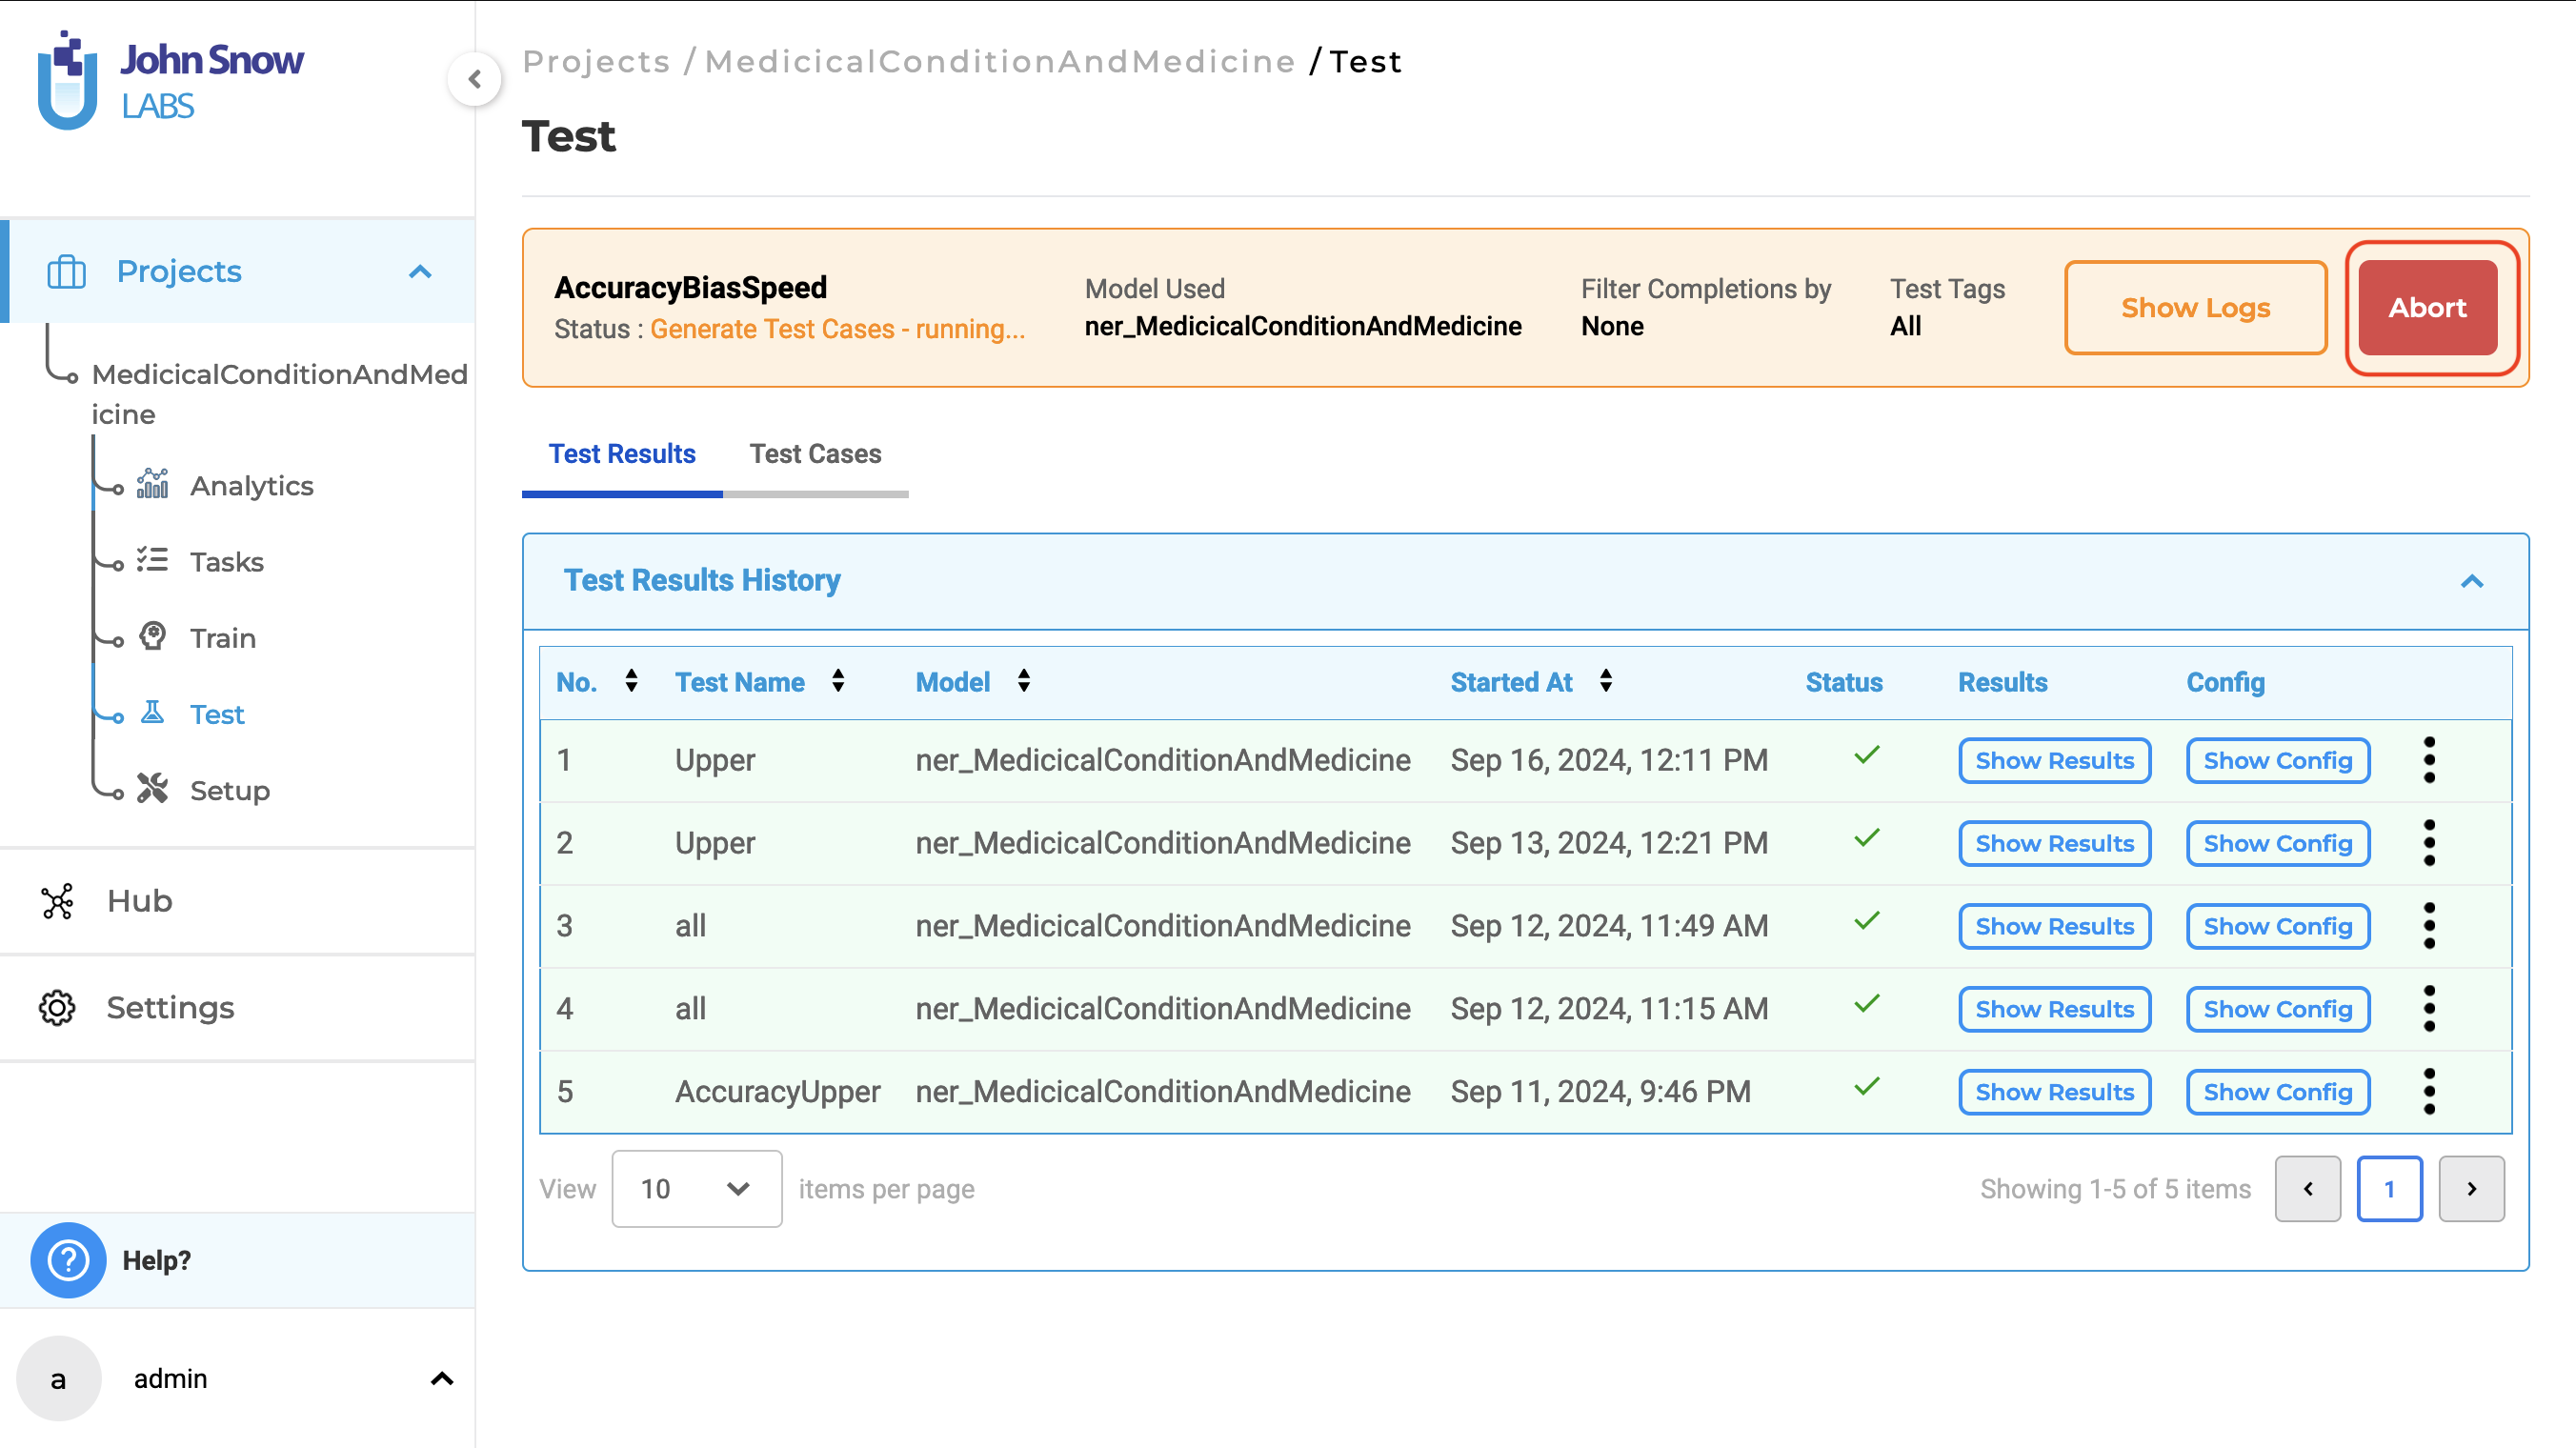
Model testing:
-
The custom pagination box has been updated with a blue border to enhance the visibility of the plus icon. This design improvement makes the icon stand out more clearly, helping users easily identify and interact with the pagination controls. The blue border provides a visual cue, making the navigation process more intuitive and user-friendly.
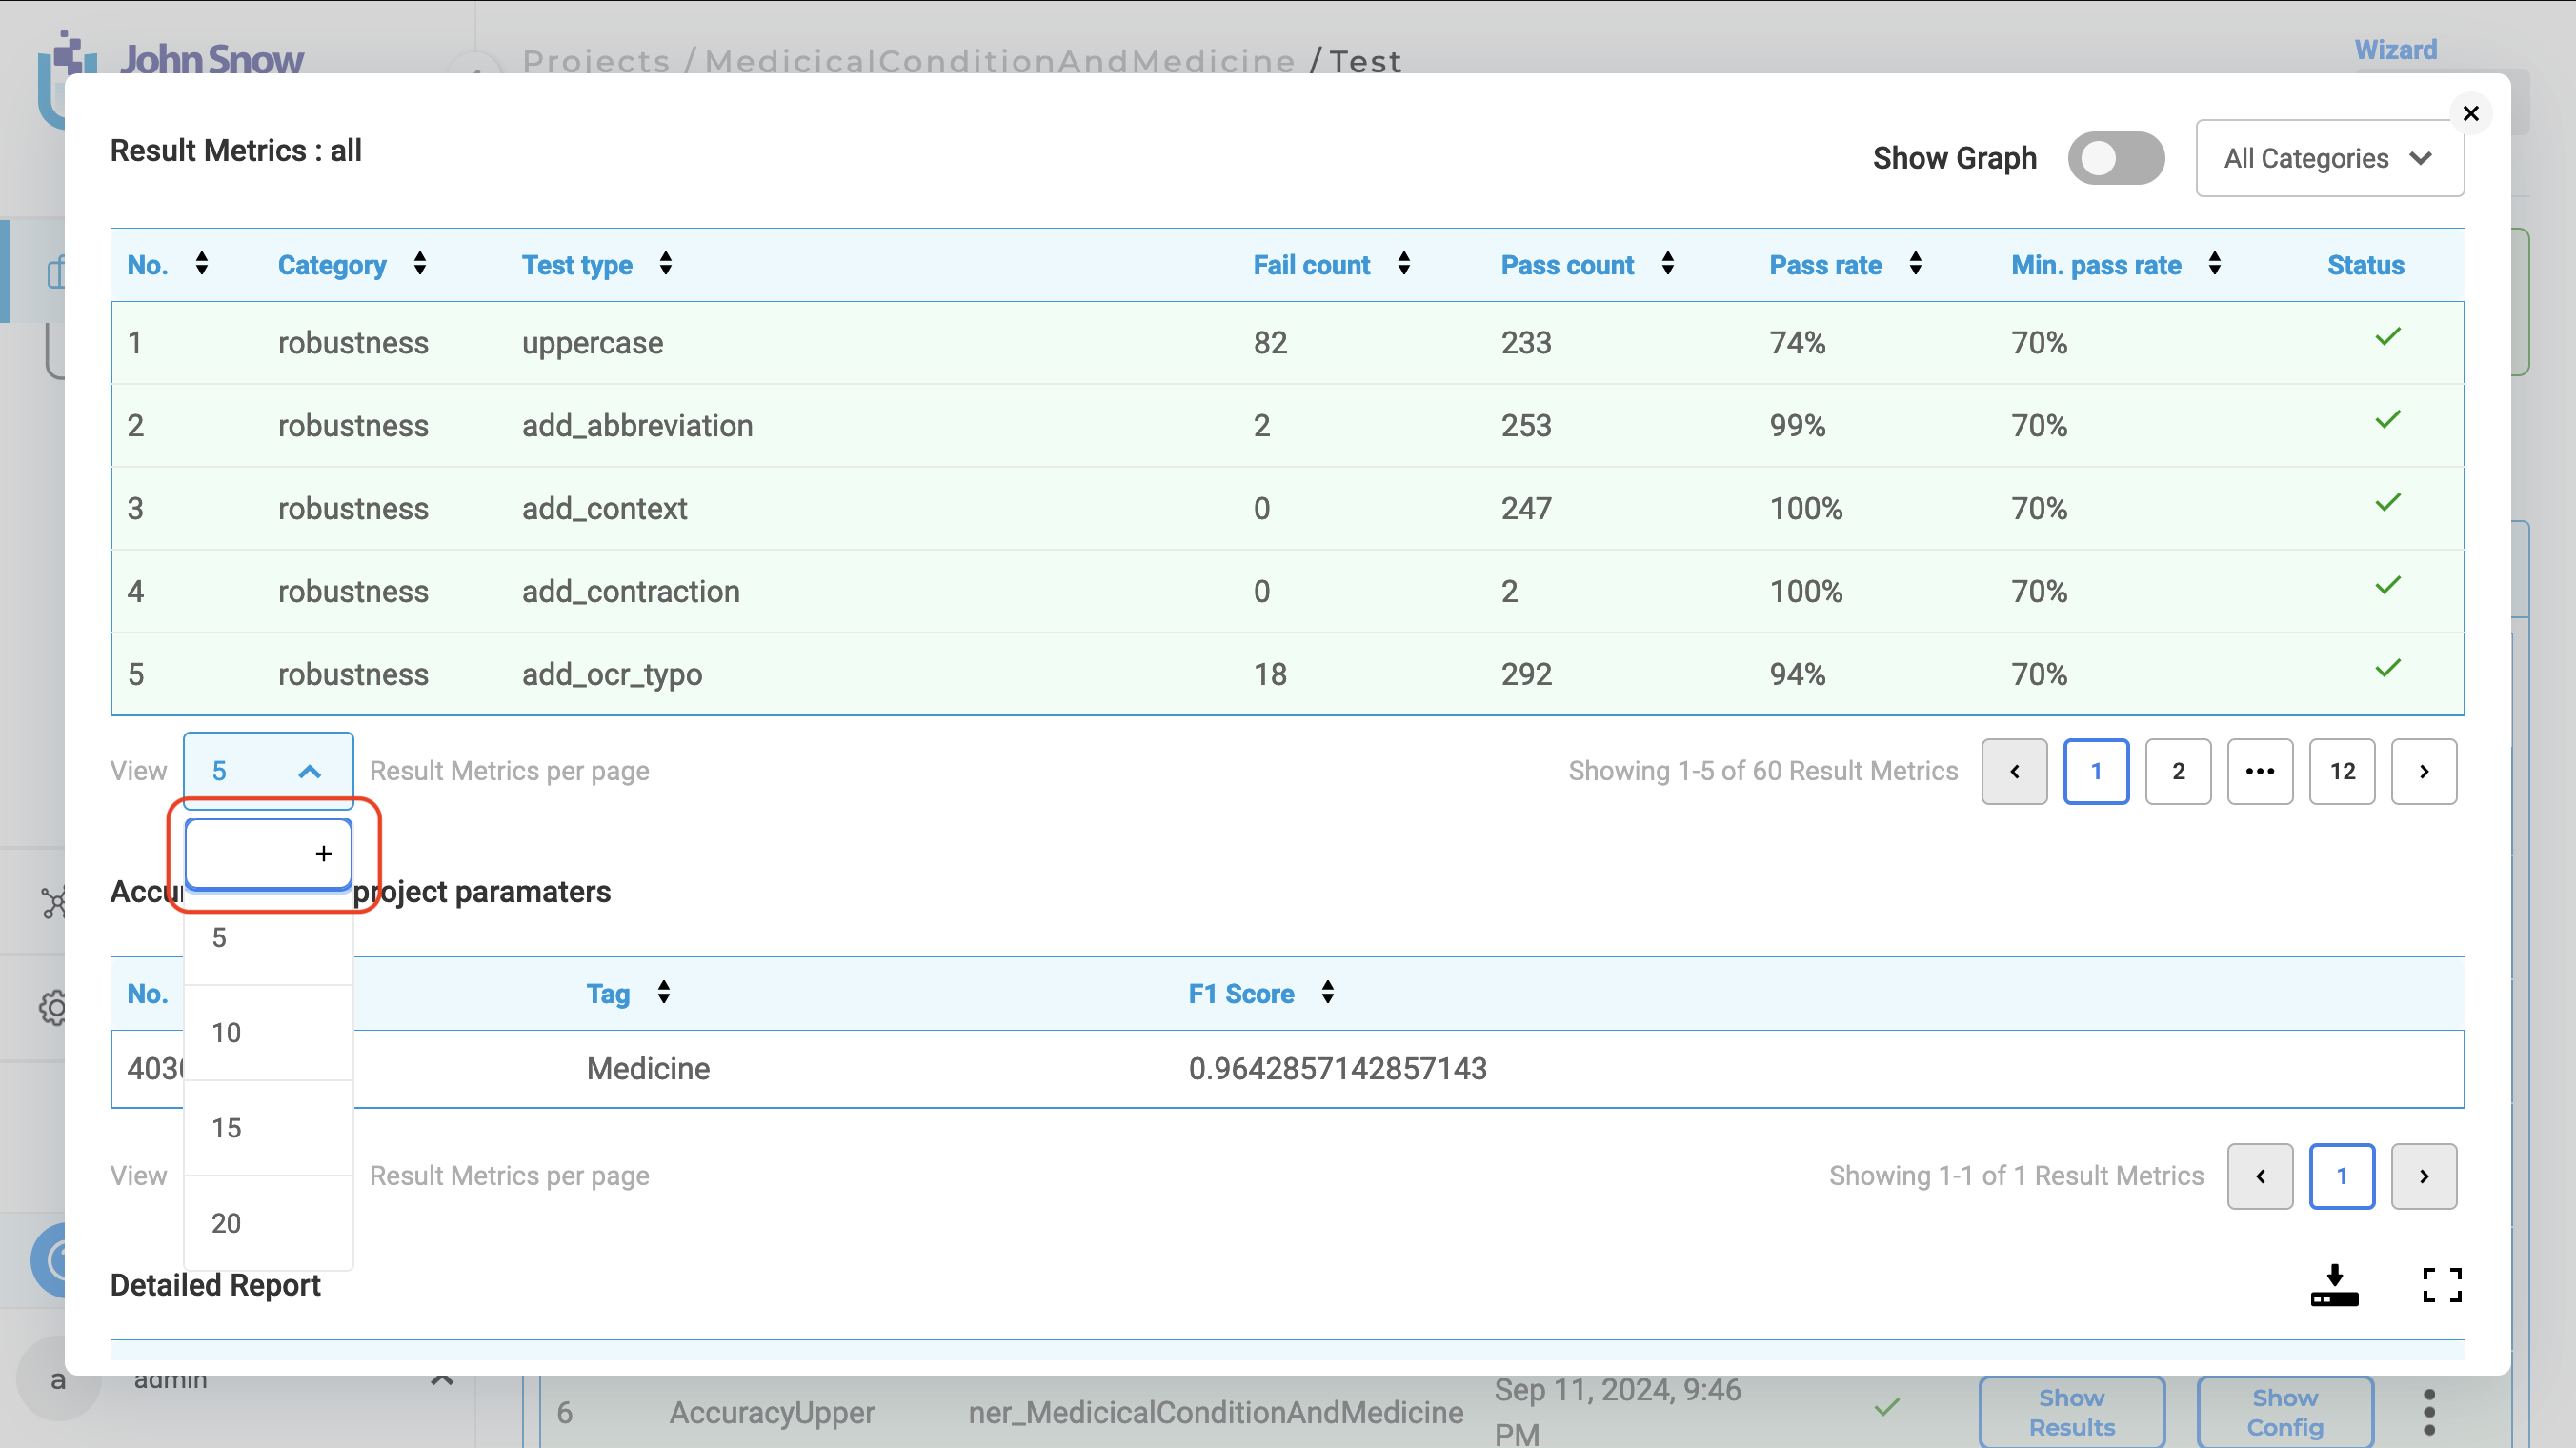
-
In the Select Test Suite drop-down, the model type is now displayed in parentheses after the test suite name. This allows users to easily identify which model type each test suite is designed for.
Support for GPU-enabled Generative AI lab in RedHat OS
Users can now install the GPU-enabled Generative AI Lab on RedHat OS. Utilizing a GPU will significantly reduce training time for Visual projects, providing notable benefits for users on RedHat OS as well.
Import zipped documents from Cloud storage
Users can now import these zip files from cloud storage. Supported cloud storage services include S3 buckets and Azure Blob.
Relation prompt in the edit relation form
A new dropdown has been added to the Relation modal, allowing users to view and select relation prompts from the dropdown menu.
Bug Fixes
-
Search feature on the labeling page does not work for SBA tasks Users can once again use the search feature to find SBA tasks on the labeling page.
-
Page becomes unresponsive when invalid data is entered in color field Users can no longer create groups with invalid colors through the API.
-
Sorting by title is not working as expected Tasks are now sorted according to the ASCII values of their titles.
-
Exported tasks in TSV format are incorrectly exported as CSV Tasks are now properly exported as TSV files.
-
Bulk annotation and bulk deletion cannot be undone on the labeling page Users can now reverse bulk annotations and bulk deletions by clicking the undo icon on the labeling page.
-
Train Model button is disabled when transfer learning is first enabled and then disabled The button remains functional when you update the training parameters, When it was being disabled when transfer learned is first enabled.
-
Blue dot is visible at the end of each task on the labeling page The issue of a small blue dot appearing at the end of each task on the labeling page has been resolved. This blue dot is no longer visible at the end of each task moving forward.
-
External Service Provider can be created without service provider name The external service provider providing an appropriate toast message when the validate button is clicked.
-
Pipelines page is forbidden for users with Supervisor Role Users with the supervisor role can now access the pipeline page and view the downloaded pipelines.
-
External Service Provider cannot be integrated when character count exceeds 64 for secret key The new maximum allowed length for the secret key has been increased to 256 characters.
-
Dropdown for ER models/Look-up codes and Assertion are available for visual project types The drop downs for ER models, Lookup Codes, and the option to enable/disable assertion will not be available for Visual Projects.
Versions
- 8.2.0
- 8.1.3
- 8.1.2
- 8.1.1
- 8.1.0
- 8.0.1
- 8.0.0
- 7.8.2
- 7.8.1
- 7.8
- 7.7
- 7.6.0
- 7.5.1
- 7.5.0
- 7.4.0
- 7.3.1
- 7.3.0
- 7.2.2
- 7.2.1
- 7.2.0
- 7.1.0
- 7.0.1
- 7.0.0
- 6.11.3
- 6.11.2
- 6.11.1
- 6.11.0
- 6.10.1
- 6.10.0
- 6.9.1
- 6.9.0
- 6.8.1
- 6.8.0
- 6.7.2
- 6.7.0
- 6.6.0
- 6.5.1
- 6.5.0
- 6.4.1
- 6.4.0
- 6.3.2
- 6.3.0
- 6.2.1
- 6.2.0
- 6.1.2
- 6.1.1
- 6.1.0
- 6.0.2
- 6.0.0
- 5.9.3
- 5.9.2
- 5.9.1
- 5.9.0
- 5.8.1
- 5.8.0
- 5.7.1
- 5.7.0
- 5.6.2
- 5.6.1
- 5.6.0
- 5.5.3
- 5.5.2
- 5.5.1
- 5.5.0
- 5.4.1
- 5.3.2
- 5.2.3
- 5.2.2
- 5.1.1
- 5.1.0