The Analytics Dashboard provides a centralized workspace for monitoring annotation progress, team productivity, annotation quality, inter-annotator agreement, and LLM evaluation metrics across Generative AI Lab projects.
The dashboard is organized into dedicated analytics pages and contextual tabs, allowing project managers, reviewers, and annotation teams to efficiently navigate operational and quality metrics across large-scale annotation workflows.
Analytics capabilities include:
- Task and project monitoring
- Annotation quality analysis
- Team productivity tracking
- Inter-Annotator Agreement (IAA) analysis
- LLM response comparison and evaluation analytics
- Exportable charts and operational reporting
Most analytics charts support filtering, provider selection, annotator comparison, and data export directly from the dashboard interface.
Dashboard Navigation
The Analytics section is accessible directly from the project sidebar and is divided into multiple analytics categories depending on the project type and workflow configuration.
Available sections may include:
- Overview
- Labels & Data Quality
- Team Productivity
- Inter-Annotator Agreement
- LLM Response Comparison
Overview Dashboard
The Overview dashboard provides high-level operational metrics for monitoring project progress and annotation workflow status.
Overview widgets and charts include:
- Total Tasks
- Completion Rate
- Reviewed Rate
- Total Completions
- Task Status Distribution
- Progress Summary
The dashboard combines summary metrics with visual charts to provide quick visibility into annotation throughput and workflow progression.
Labels & Data Quality
The Labels & Data Quality section focuses on annotation consistency, label usage patterns, and dataset-level quality analysis.
Available analytics may include:
- Label frequency distribution
- Label variability analysis
- Label usage across annotators
- Average tokens per label
- Distinct versus total label counts
These analytics help identify annotation inconsistencies, taxonomy imbalance, and labeling trends across datasets and annotation teams.
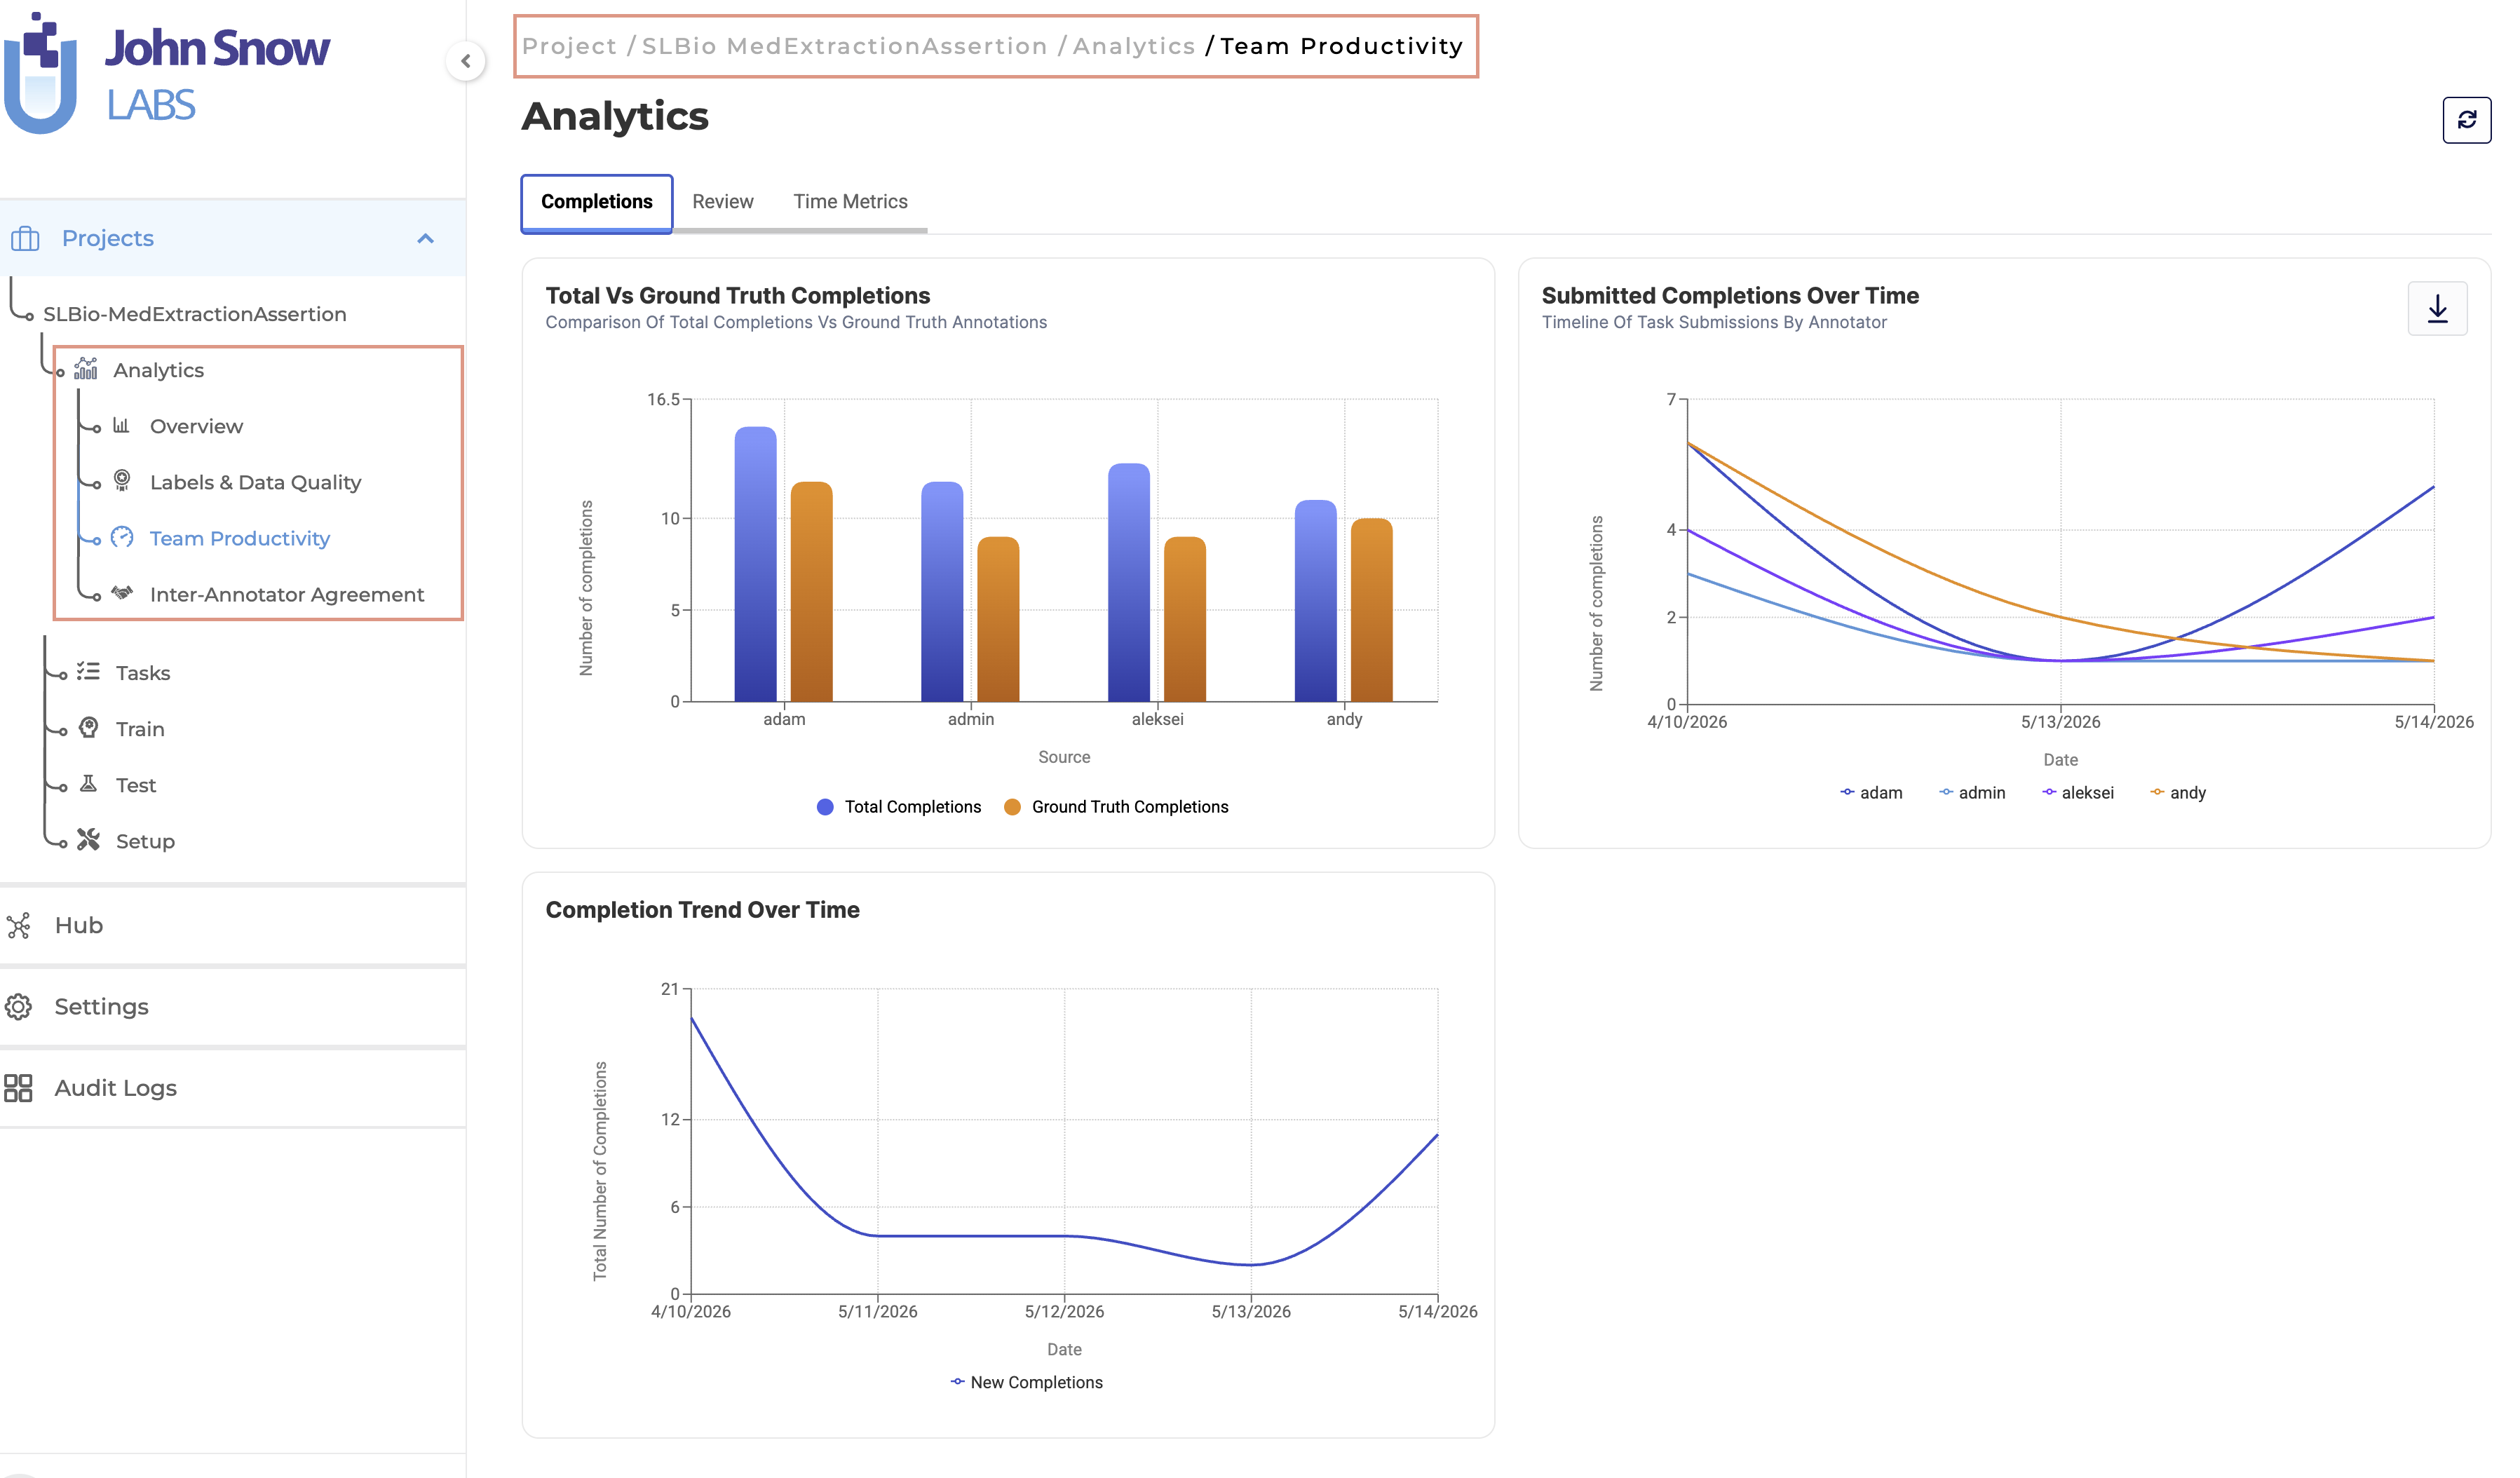
Team Productivity Dashboard
The Team Productivity dashboard organizes operational metrics into dedicated analytics tabs focused on completion activity, review performance, and time-based productivity analysis.
Available tabs include:
- Completions
- Review
- Time Metrics
Completion Analytics
The Completions section focuses on:
- Completion trend analysis
- Annotator throughput
- Submission activity over time
- Team-wide annotation volume
Review Analytics
Review analytics provide visibility into:
- Average tokens for submitted and reviewed tasks
- Average reviews per annotator
- Submitted vs reviewed task ratios
- Total token volume across reviews
Time Metrics
The Time Metrics section includes:
- Average time spent per task
- Average edit time per task
- Average number of edits per task
Together, these metrics help teams identify annotation bottlenecks, uneven workload distribution, and review inefficiencies.
Inter-Annotator Agreement Dashboard
The Inter-Annotator Agreement (IAA) dashboard provides detailed agreement analysis and disagreement tracking across annotation teams.
The redesigned dashboard separates agreement analytics into structured analytical sections, improving visibility into annotation consistency across large projects.
Agreement Overview
The Overview section includes:
- Annotator comparison filters
- Entity type selection
- NER agreement analysis
- Assertion agreement analysis
- Chunk-level agreement visualizations
- Detailed agreement tables for common tasks
Chunk-Level Analysis
Chunk-level analytics provide:
- Chunk extraction tables by annotator
- Chunk frequency analysis
- Label-based cross-reference tables
- Disagreement identification support
These tools help project managers and reviewers identify annotation inconsistencies and improve annotation guideline alignment across teams.
LLM Response Comparison Dashboard
The LLM Response Comparison dashboard provides dedicated analytics for projects evaluating and comparing Large Language Model outputs.
The dashboard uses dynamic tabs to organize evaluation metrics into focused analytical sections.
Available tabs include:
- LLM Choices
- Labels
- Quality Ratings
The active tab updates dynamically without requiring a page refresh.
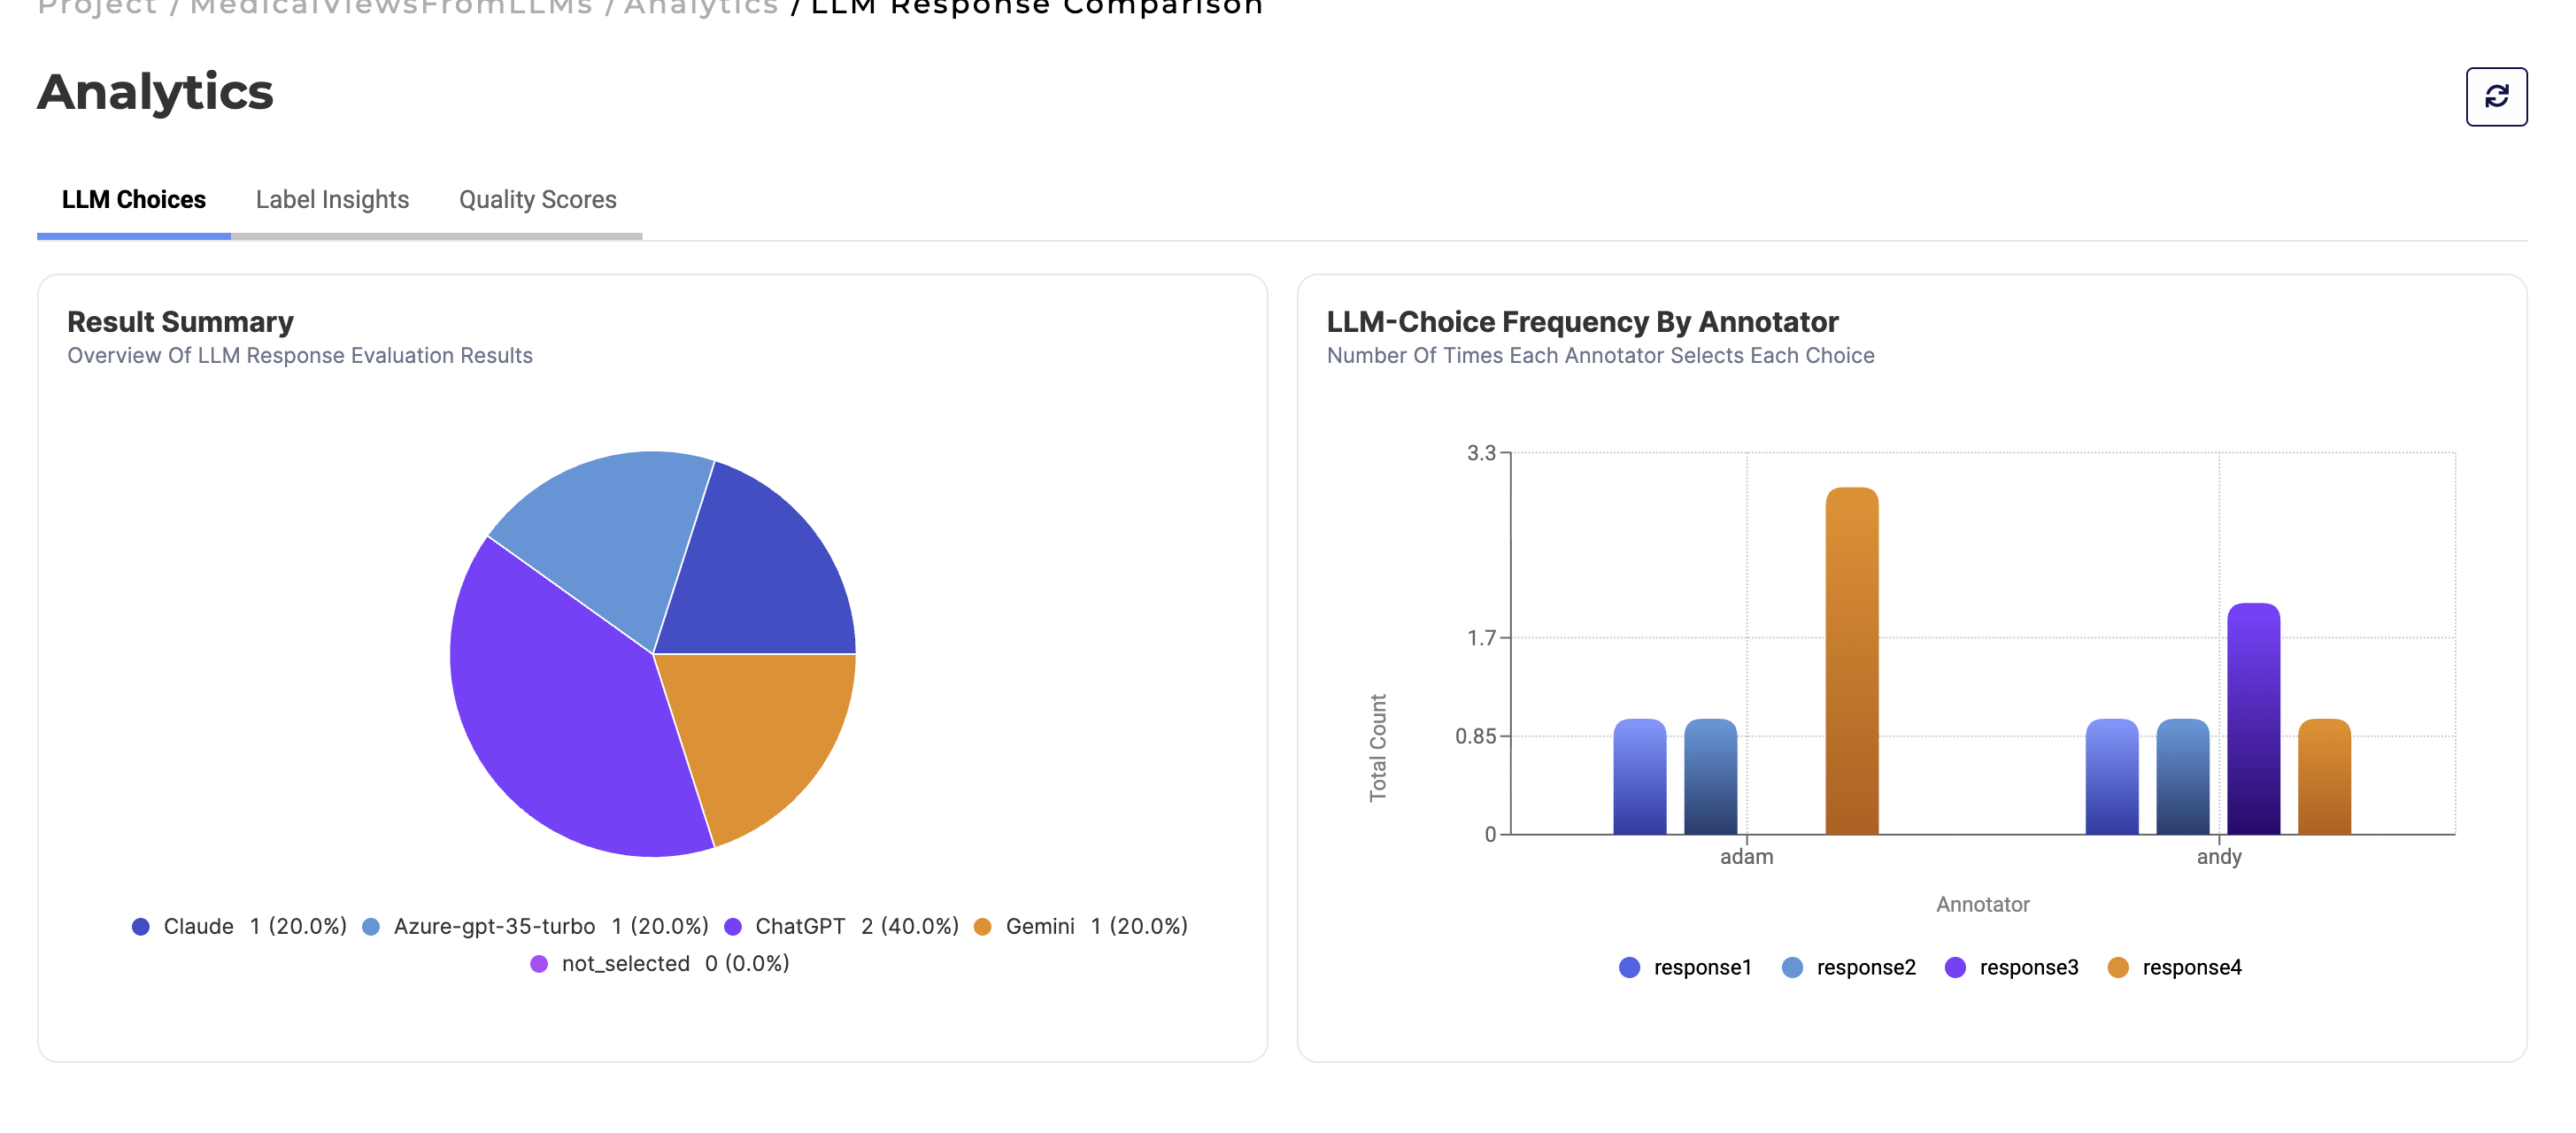
LLM Choices Tab
The LLM Choices section includes:
Result Summary
- Donut chart visualization of selected LLM responses
- Annotator preference distribution across providers
Choice Frequency by Annotator
- Dynamic bar charts comparing annotator selections across providers
- Interactive provider selection filters
- Automatic chart refresh when providers change
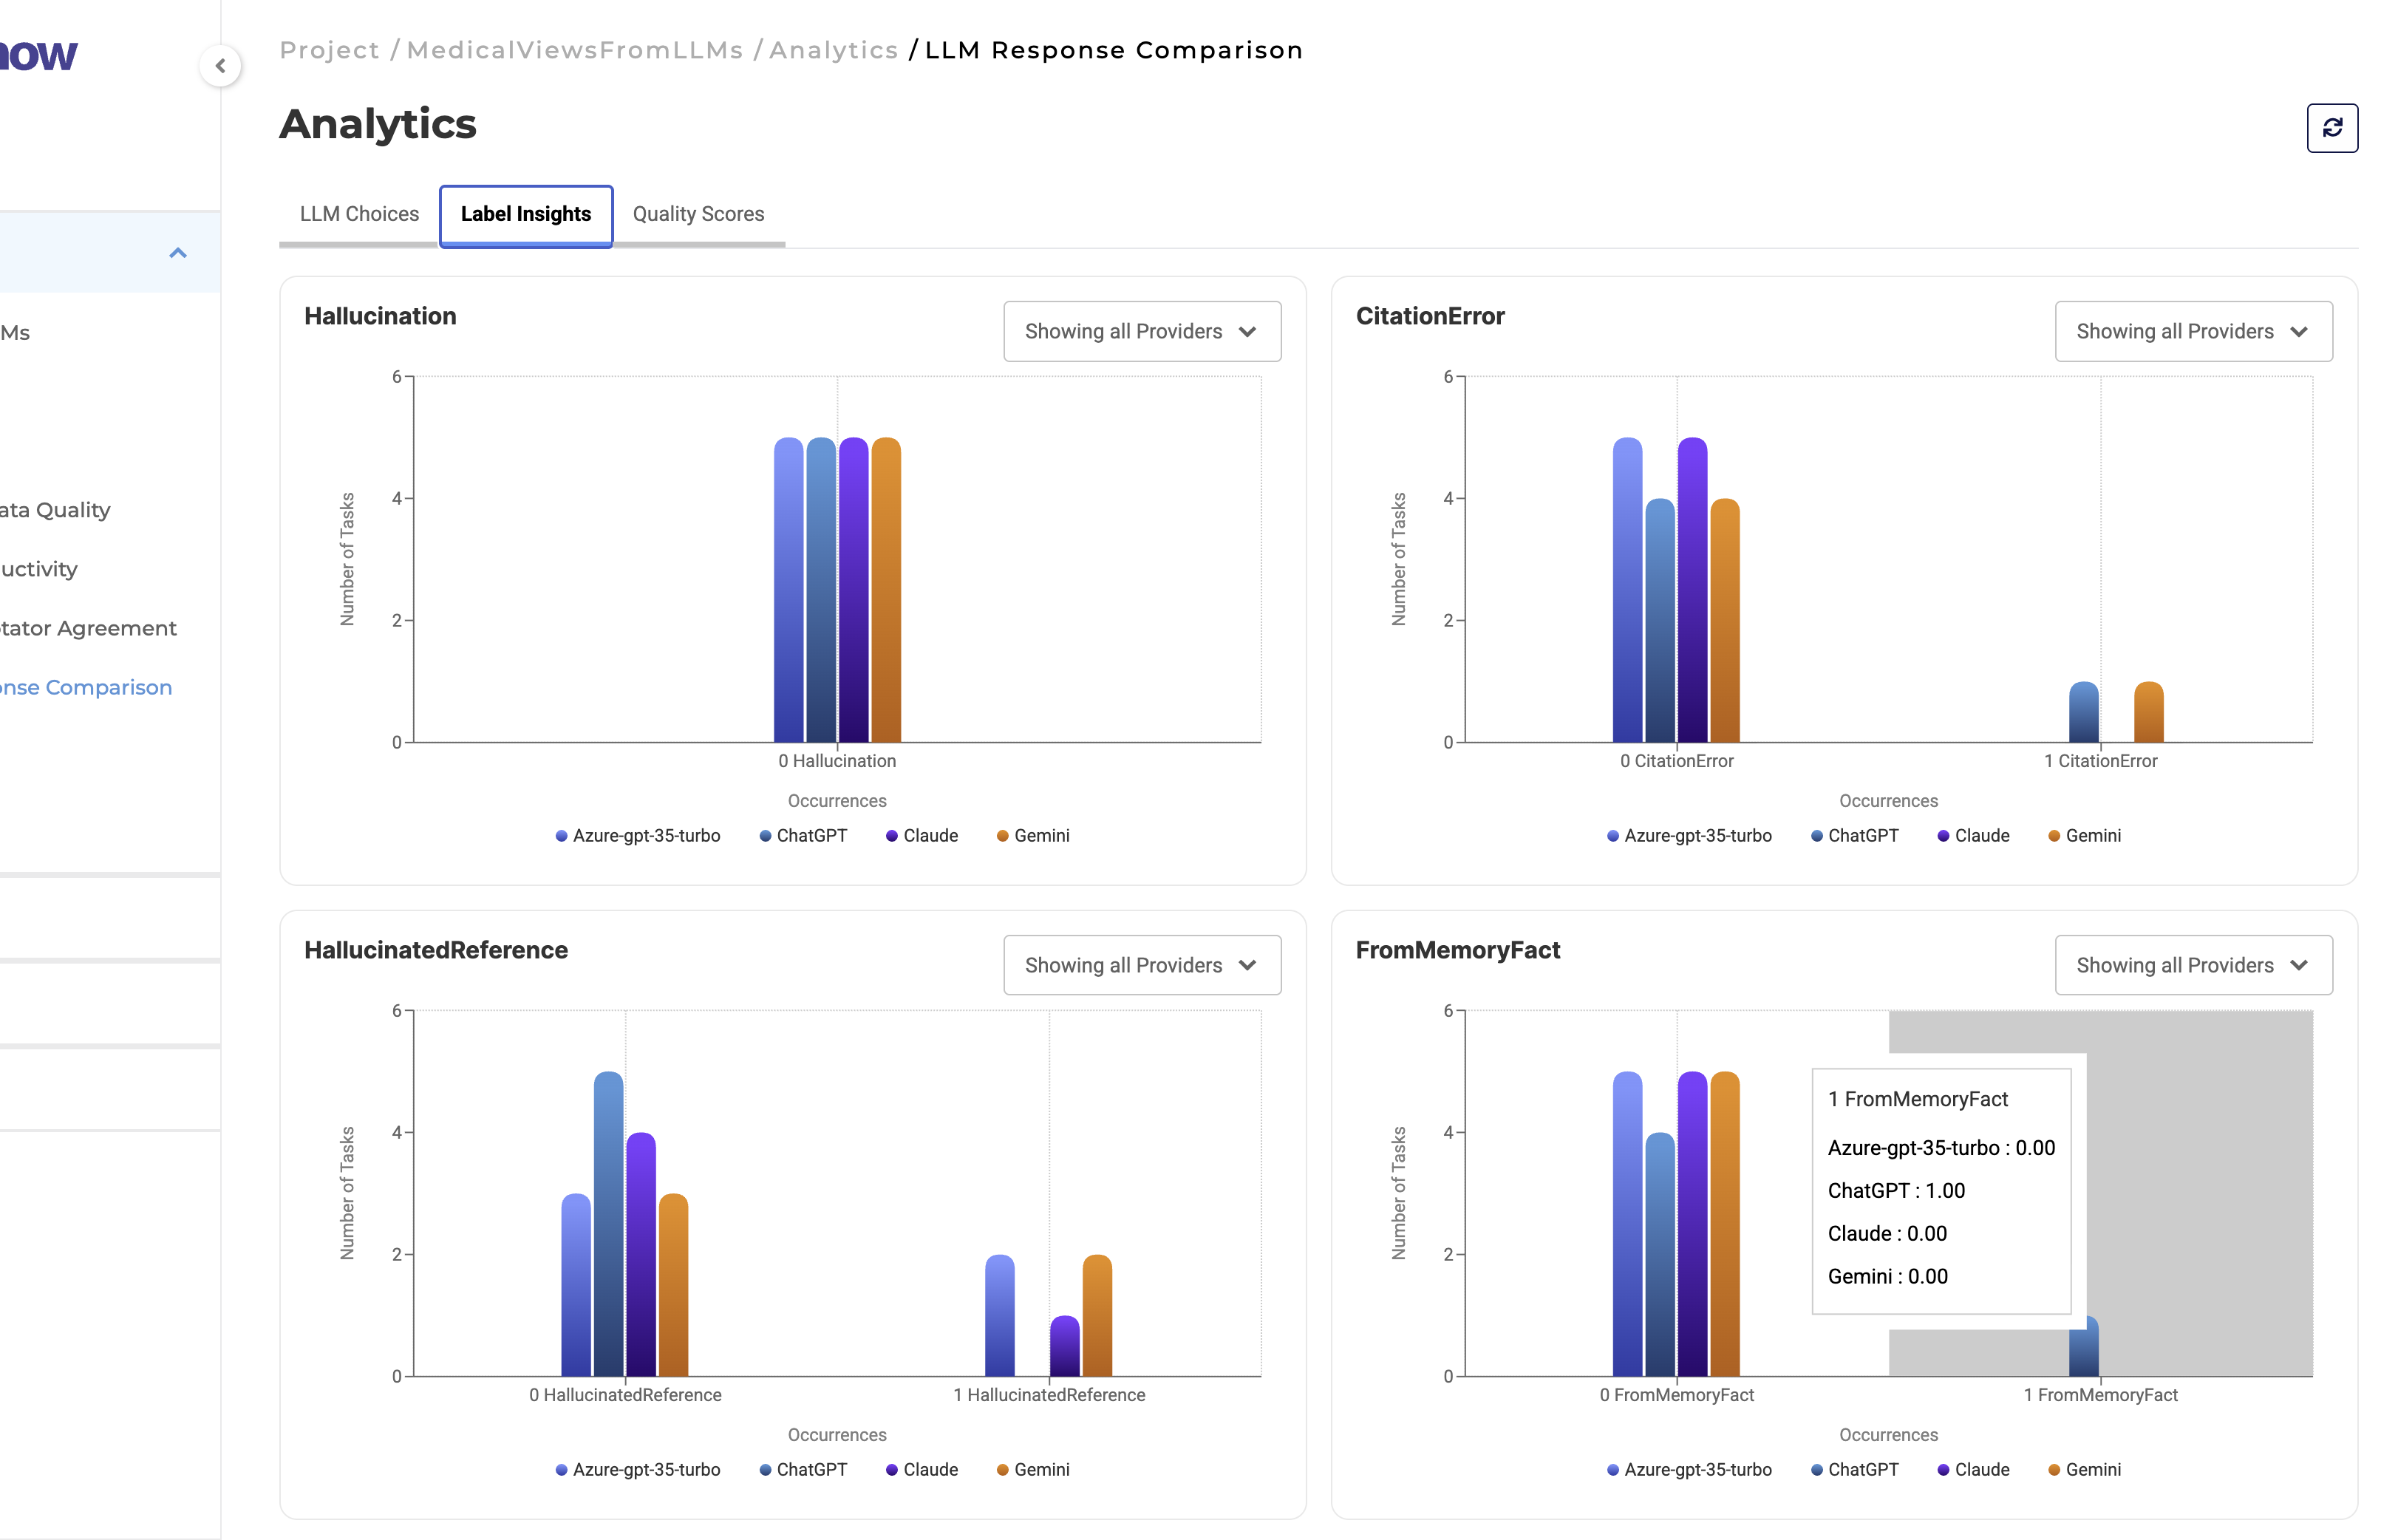
Labels Tab
The Labels tab centralizes hallucination analysis, citation tracking, and label-based evaluation metrics across compared LLM providers.
Quality Ratings Tab
The Quality Ratings section groups quality evaluation metrics into a dedicated analytics view.
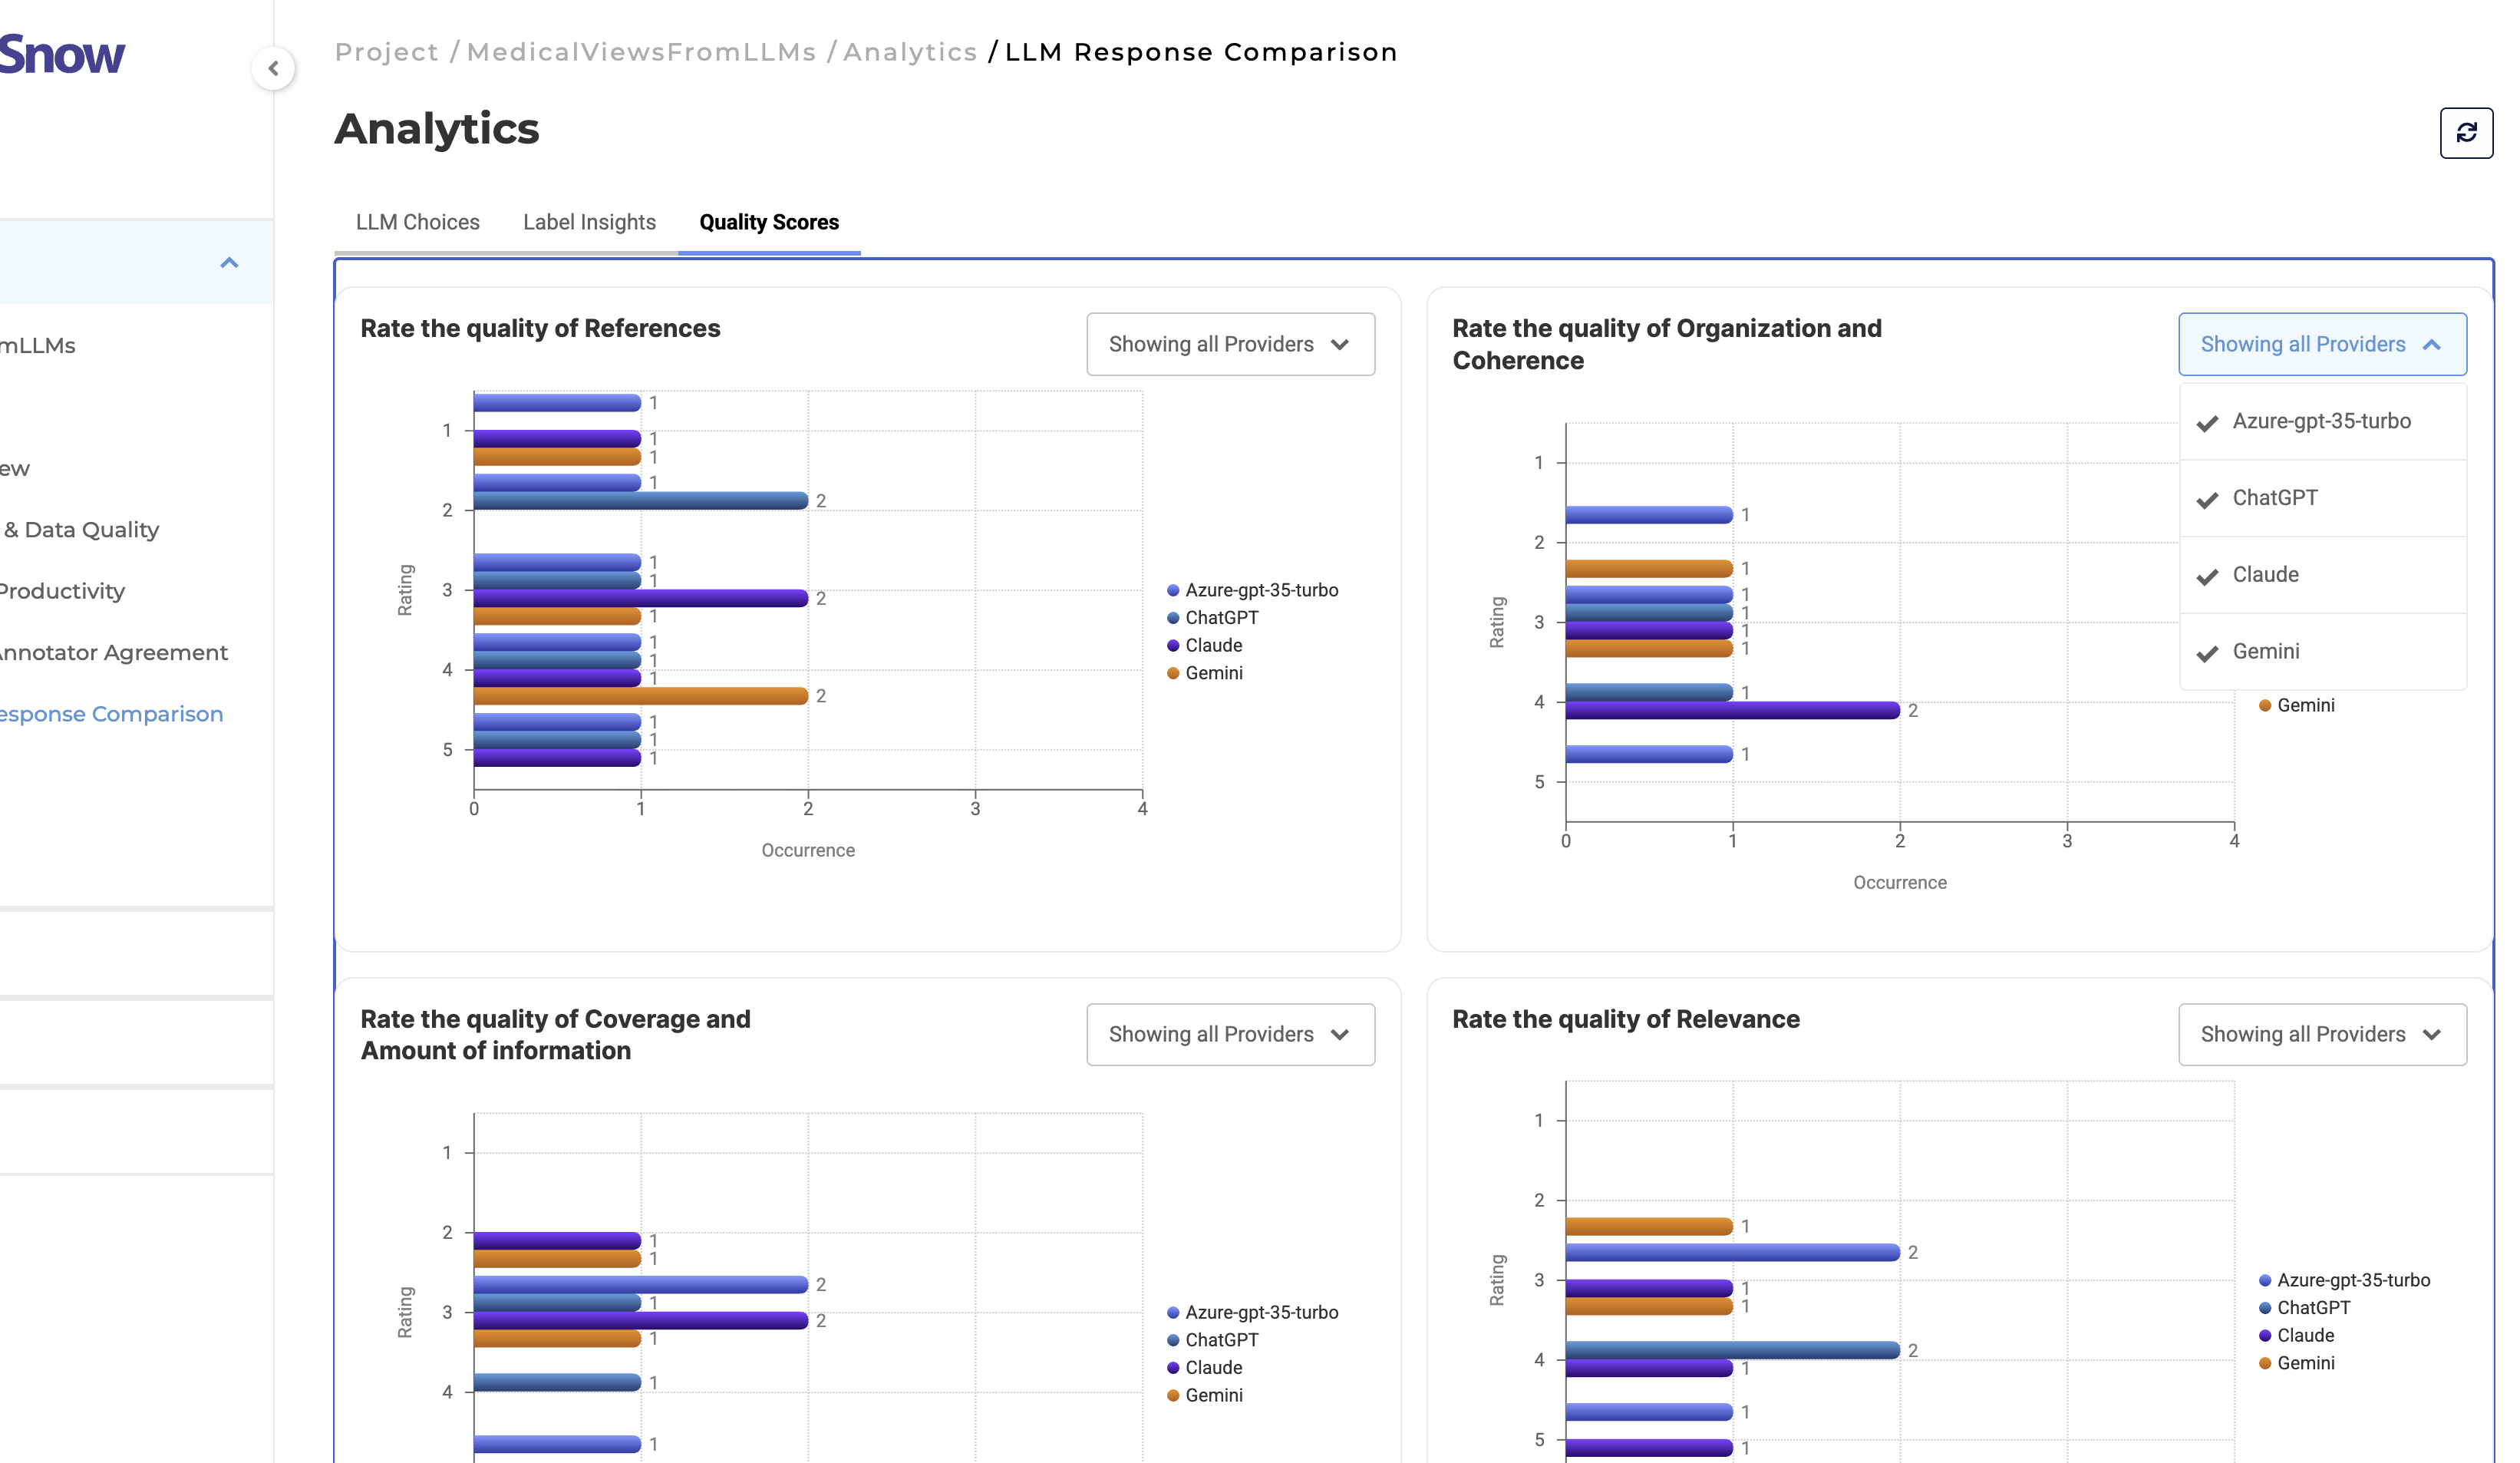
The dashboard supports analytics for:
- Relevance
- Coverage
- Organization and coherence
- Reference quality
- Overall helpfulness
This enables teams to analyze qualitative evaluation trends across compared LLM providers.
User Benefits
Improved Analytics Discoverability
Structured navigation and contextual tabs make it easier to locate relevant operational insights, KPIs, and quality metrics.
Better Scalability for Large Projects
Dedicated analytics sections reduce clutter and improve usability for projects containing large volumes of annotation and evaluation data.
Cleaner and More Focused User Experience
Simplified layouts, optimized chart density, and standardized visual components reduce cognitive overhead during dashboard analysis.
Faster Operational Decision-Making
Interactive filtering and centralized analytics provide quicker access to annotation progress, productivity trends, and quality insights.
Improved Annotation Oversight
Project managers can monitor:
- Team productivity
- Review performance
- Annotation throughput
- Agreement trends
- LLM evaluation metrics
from a unified analytics environment.
Enhanced Quality Monitoring
Dedicated analytics for label variability and agreement analysis help identify annotation inconsistencies and potential taxonomy issues earlier in the workflow.
Optimized LLM Evaluation Workflows
Specialized dashboards for response comparison projects provide clearer visibility into annotator preferences and LLM evaluation behavior.
More Efficient Navigation
The redesigned multi-tab layout eliminates excessive scrolling and improves movement between analytics categories and operational views.
Example Workflow
A project manager overseeing a large healthcare annotation project requests Analytics access for their project. Once Analytics is approved and enabled by an administrator, the project manager can access the Analytics Dashboard directly from the project sidebar.
For more information about enabling Analytics access and permission management, see the Analytics Permission Management documentation.
Using the sidebar navigation, the manager switches between:
- Overview to review task completion and productivity metrics
- Team Productivity to analyze annotator throughput and review activity
- Labels & Data Quality to identify annotation imbalance and variability
- Inter-Annotator Agreement to investigate disagreement trends between reviewers
- LLM Response Comparison to evaluate annotator preferences across multiple LLM responses
Instead of navigating through a single long analytics page, the manager can move directly between focused dashboard sections and contextual tabs to locate specific operational insights quickly.
This enables:
- Faster operational analysis
- Improved annotation oversight
- Better quality monitoring
- More efficient reviewer coordination
- Streamlined large-scale project management workflows