ImageTableDetector
ImageTableDetector is a DL model for detecting tables on the image.
It’s based on CascadeTabNet which used Cascade mask Region-based CNN High-Resolution Network (Cascade mask R-CNN HRNet).
Input Columns
| Param name | Type | Default | Column Data Description |
|---|---|---|---|
| inputCol | string | image | image struct (Image schema) |
Parameters
| Param name | Type | Default | Description |
|---|---|---|---|
| scoreThreshold | float | 0.9 | Score threshold for output regions. |
| applyCorrection | boolean | false | Enable correction of results. |
Output Columns
| Param name | Type | Default | Column Data Description |
|---|---|---|---|
| outputCol | string | table_regions | array of [Coordinaties]ocr_structures#coordinate-schema) |
Example:
import com.johnsnowlabs.ocr.transformers.*
import com.johnsnowlabs.ocr.OcrContext.implicits._

val imagePath = "path to image"

// Read image file as binary file
val df = spark.read
  .format("binaryFile")
  .load(imagePath)
  .asImage("image")

// Define transformer for detect tables
val table_detector = ImageTableDetector
  .pretrained("general_model_table_detection_v2")
  .setInputCol("image")
  .setOutputCol("table_regions")

val draw_regions = new ImageDrawRegions()
  .setInputCol("image")
  .setInputRegionsCol("table_regions")
  .setOutputCol("image_with_regions")


pipeline = PipelineModel(stages=[
    binary_to_image,
    table_detector,
    draw_regions
])

val data = pipeline.transform(df)

data.storeImage("image_with_regions")
from pyspark.ml import PipelineModel
from sparkocr.transformers import *

imagePath = "path to image"

# Read image file as binary file
df = spark.read
    .format("binaryFile")
    .load(imagePath)

binary_to_image = BinaryToImage() \
    .setInputCol("content") \
    .setOutputCol("image")

# Define transformer for detect tables
table_detector = ImageTableDetector \
  .pretrained("general_model_table_detection_v2", "en", "clinical/ocr") \
  .setInputCol("image") \
  .setOutputCol("table_regions")

draw_regions = ImageDrawRegions() \
  .setInputCol("image") \
  .setInputRegionsCol("table_regions") \
  .setOutputCol("image_with_regions")


pipeline = PipelineModel(stages=[
    binary_to_image,
    table_detector,
    draw_regions
])

data = pipeline.transform(df)

display_images(data, "image_with_regions")
Output:
ImageTableCellDetector
ImageTableCellDetector detect cells in a table image. It’s based on an
image processing algorithm that detects horizontal and vertical lines.
Current implementation support few algorithm for extract cells:
- CellDetectionAlgos.CONTOURS works only for bordered tables.
- CellDetectionAlgos.MORPHOPS works for bordered, borderless and combined tables.
Input Columns
| Param name | Type | Default | Column Data Description |
|---|---|---|---|
| inputCol | string | image | image struct (Image schema) |
Parameters
| Param name | Type | Default | Description |
|---|---|---|---|
| algoType | CellDetectionAlgos | CellDetectionAlgos.CONTOURS | Algorithm for detect cells. |
| algoParams | string | row_treshold=0.05,row_treshold_wide=1.0, row_min_wide=5,column_treshold=0.05, column_treshold_wide=5,column_min_wide=5 | Parameters of ‘MORPHOPS’ cells detection algorithm |
| drawDetectedLines | boolean | false | Enable to draw detected lines to the output image |
| keepOriginalLines | boolean | false | Keep original images on the output image |
Output Columns
| Param name | Type | Default | Column Data Description |
|---|---|---|---|
| outputCol | string | cells | array of coordinates of cells |
| outputImageCol | string | output_image | output image |
Example:
import com.johnsnowlabs.ocr.transformers.*
import com.johnsnowlabs.ocr.OcrContext.implicits._

val imagePath = "path to image"

// Read image file as binary file
val df = spark.read
  .format("binaryFile")
  .load(imagePath)
  .asImage("image")

// Define transformer for detect cells
val transformer = new ImageTableCellDetector()
  .setInputCol("image")
  .setOutputCol("cells")

val data = transformer.transform(df)

data.select("cells").show()
from pyspark.ml import PipelineModel
from sparkocr.transformers import *

imagePath = "path to image"

# Read image file as binary file
df = spark.read
    .format("binaryFile")
    .load(imagePath)

binary_to_image = BinaryToImage() \
    .setInputCol("content") \
    .setOutputCol("image")

# Define transformer for detect cells
transformer = ImageTableCellDetector \
  .setInputCol("image") \
  .setOutputCol("cells") \
  .setAlgoParams("row_treshold=0.05")

pipeline = PipelineModel(stages=[
    binary_to_image,
    transformer
])

data = pipeline.transform(df)
data.select("cells").show()
Image:
Output:*
+----------------------------------------------------------+
| cells                                                    |
+----------------------------------------------------------+
||[[[[15, 17, 224, 53]], [[241, 17, 179, 53]], [[423, 17,  |
| 194, 53]], [[619, 17, 164, 53]] ....                     |
+----------------------------------------------------------+
ImageCellsToTextTable
ImageCellsToTextTable runs OCR for cells regions on image, return recognized text
to outputCol as TableContainer structure.
Input Columns
| Param name | Type | Default | Column Data Description |
|---|---|---|---|
| inputCol | string | image | image struct (Image schema) |
| cellsCol | string | celss | Array of cells |
Parameters
| Param name | Type | Default | Description |
|---|---|---|---|
| strip | bool | true | Strip output text. |
| margin | bool | 1 | Margin of cells in pixelx. |
| pageSegMode | PageSegmentationMode | AUTO | page segmentation mode |
| ocrEngineMode | EngineMode | LSTM_ONLY | OCR engine mode |
| language | Language | Language.ENG | language |
| ocrParams | array of strings | [] | Array of Ocr params in key=value format. |
| pdfCoordinates | bool | false | Transform coordinates in positions to PDF points. |
| modelData | string | Path to the local model data. | |
| modelType | ModelType | ModelType.BASE | Model type |
| downloadModelData | bool | false | Download model data from JSL S3 |
| outputFormat | TableOutputFormat | TableOutputFormat.TABLE | Output format |
Output Columns
| Param name | Type | Default | Column Data Description |
|---|---|---|---|
| outputCol | string | table | Recognized text as TableContainer |
Example:
import org.apache.spark.ml.Pipeline
import com.johnsnowlabs.ocr.transformers.*
import com.johnsnowlabs.ocr.OcrContext.implicits._

val imagePath = "path to image"

// Read image file as binary file
val df = spark.read
  .format("binaryFile")
  .load(imagePath)
  .asImage("image")

// Define transformer for detect cells
val cell_detector = new ImageTableCellDetector()
  .setInputCol("image")
  .setOutputCol("cells")

val table_recognition = new ImageCellsToTextTable()
  .setInputCol("image")
  .setOutputCol("tables")
  .setMargin(2)

// Define pipeline
val pipeline = new Pipeline()
pipeline.setStages(Array(
  cell_detector,
  table_recognition
))

val modelPipeline = pipeline.fit(spark.emptyDataFrame)

val results = modelPipeline.transform(df)

results.select("tables")
  .withColumn("cells", explode(col("tables.chunks")))
  .select((0 until 7).map(i => col("cells")(i).getField("chunkText").alias(s"col$i")): _*)
  .show(false)
from pyspark.ml import PipelineModel
import pyspark.sql.functions as f
from sparkocr.transformers import *

imagePath = "path to image"

# Read image file as binary file
df = spark.read
    .format("binaryFile")
    .load(imagePath)

binary_to_image = BinaryToImage()
binary_to_image.setImageType(ImageType.TYPE_BYTE_GRAY)
binary_to_image.setInputCol("content")

cell_detector = TableCellDetector()
cell_detector.setInputCol("image")
cell_detector.setOutputCol("cells")
cell_detector.setKeepInput(True)

table_recognition = ImageCellsToTextTable()
table_recognition.setInputCol("image")
table_recognition.setCellsCol('cells')
table_recognition.setMargin(2)
table_recognition.setStrip(True)
table_recognition.setOutputCol('table')

pipeline = PipelineModel(stages=[
    binary_to_image,
    cell_detector,
    table_recognition
])

result = pipeline.transform(df)

results.select("table") \
    .withColumn("cells", f.explode(f.col("table.chunks"))) \
    .select([f.col("cells")[i].getField("chunkText").alias(f"col{i}") for i in
             range(0, 7)]) \
    .show(20, False)
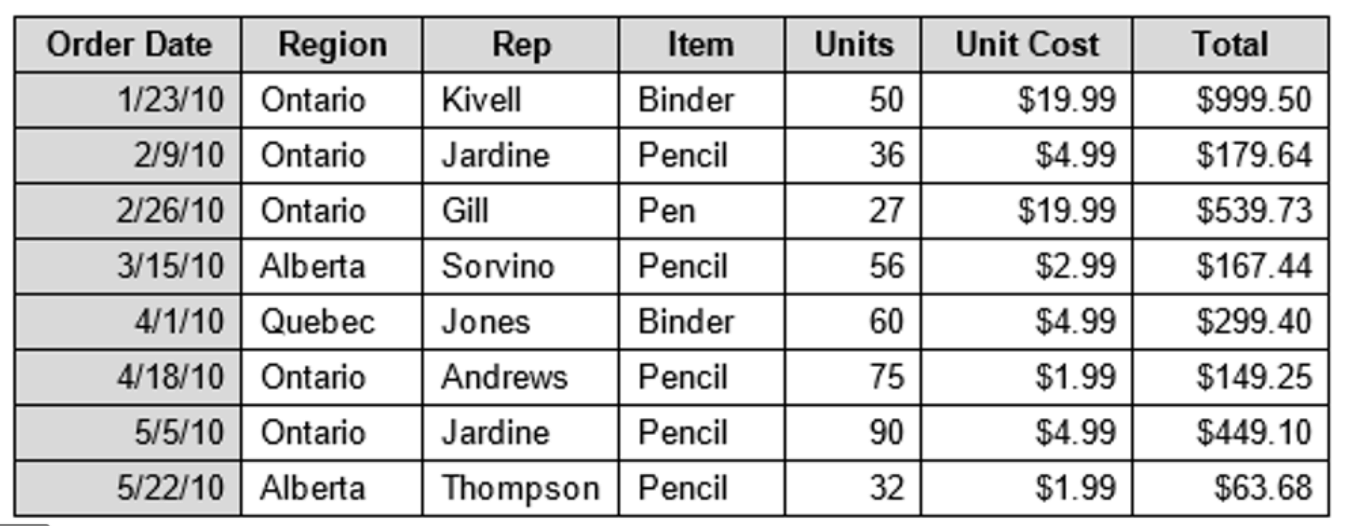
Image:
Output:
+----------+-------+--------+------+-----+---------+-------+
|col0      |col1   |col2    |col3  |col4 |col5     |col6   |
+----------+-------+--------+------+-----+---------+-------+
|Order Date|Region |Rep     |Item  |Units|Unit Cost|Total  |
|1/23/10   |Ontario|Kivell  |Binder|50   |$19.99   |$999.50|
|2/9/10    |Ontario|Jardine |Pencil|36   |$4.99    |$179.64|
|2/26/10   |Ontario|Gill    |Pen   |27   |$19.99   |$539.73|
|3/15/10   |Alberta|Sorvino |Pencil|56   |$2.99    |$167.44|
|4/1/10    |Quebec |Jones   |Binder|60   |$4.99    |$299.40|
|4/18/10   |Ontario|Andrews |Pencil|75   |$1.99    |$149.25|
|5/5/10    |Ontario|Jardine |Pencil|90   |$4.99    |$449.10|
|5/22/10   |Alberta|Thompson|Pencil|32   |$1.99    |$63.68 |
+----------+-------+--------+------+-----+---------+-------+
PREVIOUSPipeline components