Description
The Pix2Struct model, as detailed in the paper titled “Pix2Struct: Screenshot Parsing as Pretraining for Visual Language Understanding” authored by Kenton Lee, Mandar Joshi, Iulia Turc, Hexiang Hu, Fangyu Liu, Julian Eisenschlos, Urvashi Khandelwal, Peter Shaw, Ming-Wei Chang, and Kristina Toutanova, introduces a novel approach to visually-situated language understanding.
In this context, the Pix2Struct model, originally conceived as an image-to-text model for visual language understanding, has been adapted through retraining to address the specific task of answering questions in visual graphics within the domain of DocVQA (Document Visual Question Answering). This approach highlights the versatility and adaptability of the model for specialized tasks, demonstrating how it can be successfully applied in specific contexts such as the one mentioned.
Predicted Entities
answers.
Live Demo Open in Colab Copy S3 URI
How to use
binary_to_image = BinaryToImage()\
.setOutputCol("image") \
.setImageType(ImageType.TYPE_3BYTE_BGR)
visual_question_answering = VisualQuestionAnswering()\
.pretrained("info_docvqa_pix2struct_jsl_base_opt", "en", "clinical/ocr")\
.setInputCol(["image"])\
.setOutputCol("answers")\
.setQuestionsCol("questions")
# OCR pipeline
pipeline = PipelineModel(stages=[
binary_to_image,
visual_question_answering
])
test_image_path = "infographics_image.png"
bin_df = spark.read.format("binaryFile").load(test_image_path)
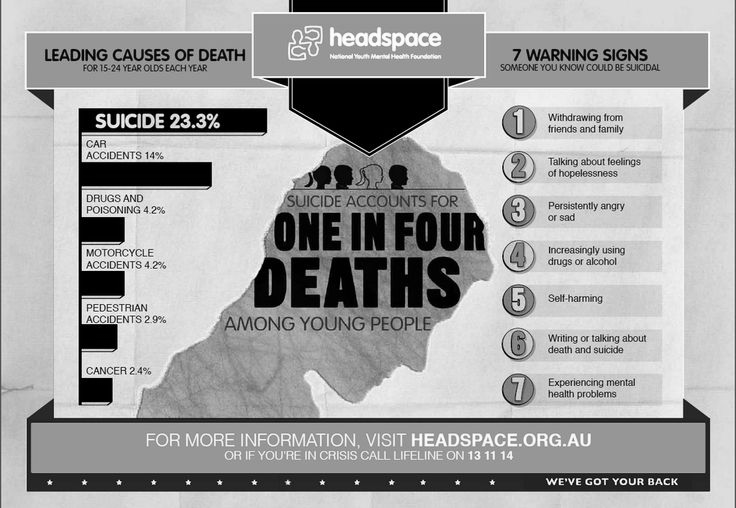
questions = [["What percentage of Suicides are caused by Motorcycle accidents?",
"What percentage of Suicides are caused by pedestrian accidents?",
"What is fifth warning sign listed here?"]]
questions_df = spark.createDataFrame([questions])
questions_df = questions_df.withColumnRenamed("_1", "questions")
image_and_questions = bin_df.join(questions_df)
results = pipeline.transform(image_and_questions).cache()
val binary_to_image = BinaryToImage()
    .setOutputCol("image")
    .setImageType(ImageType.TYPE_3BYTE_BGR)

val visual_question_answering = VisualQuestionAnswering()
    .pretrained("info_docvqa_pix2struct_jsl_base_opt", "en", "clinical/ocr")
    .setInputCol(Array("image"))
    .setOutputCol("answers")
    .setQuestionsCol("questions")

val pipeline = new PipelineModel().setStages(Array(
    binary_to_image,
    visual_question_answering))

val test_image_path = "infographics_image.png"
val bin_df = spark.read.format("binaryFile").load(test_image_path)

val questions = Array(Array("What percentage of Suicides are caused by Motorcycle accidents?",
                            "What percentage of Suicides are caused by pedestrian accidents?",
                            "What is fifth warning sign listed here?"))
val questions_df = spark.createDataFrame([questions])
val questions_df = questions_df.withColumnRenamed("_1", "questions")
val image_and_questions = bin_df.join(questions_df)

val results = pipeline.transform(image_and_questions).cache()
Example
Input:
Questions:
- What percentage of Suicides are caused by Motorcycle accidents?
- What percentage of Suicides are caused by pedestrian accidents?
- What is fifth warning sign listed here?
Image:
Output:
[{'image': ImageOutput(path: 3f878eba5bf5d66635a3f2312ca2819c.jpg, exception: None),
  'answers': AnswersOutput(questions_and_answers: [{'score': 0.9581562, 'question': 'What percentage of Suicides are caused by Motorcycle accidents? ', 'answer': '  4.2%'}, {'score': 0.98590666, 'question': 'What percentage of Suicides are caused by pedestrian accidents? ', 'answer': '  2.9%'}, {'score': 0.89071125, 'question': 'What is fifth warning sign listed here? ', 'answer': '  self-harming'}])}]
Model Information
|—|—|
|Model Name:|info_docvqa_pix2struct_jsl_base_opt|
|Type:|ocr|
|Compatibility:|Visual NLP 5.2.0+|
|License:|Licensed|
|Edition:|Official|
|Language:|en|