Description
DePlot, as outlined in the paper “DePlot: One-shot visual language reasoning by plot-to-table translation,” offers a groundbreaking one-shot solution for visual language reasoning, requiring minimal training data compared to previous models. By breaking down the process into plot-to-text translation and subsequent reasoning, DePlot converts images of plots or charts into structured tables, enabling pretrained large language models (LLMs) to perform robust reasoning with just a few prompts. Trained end-to-end on standardized tasks, DePlot demonstrates a significant 24.0% improvement over state-of-the-art models on human-written queries, showcasing its efficiency even with limited data. Integrated within the Pix2Struct architecture, DePlot excels in Visual Question Answering tasks, rendering input questions on images and accurately predicting answers.
Predicted Entities
answers.
Live Demo Open in Colab Copy S3 URI
How to use
binary_to_image = BinaryToImage()\
    .setOutputCol("image") \
    .setImageType(ImageType.TYPE_3BYTE_BGR)

chart_to_text = ChartToTextTable()\
    .pretrained("chart_to_text_deplot_jsl", "en", "clinical/ocr")\
    .setInputCol(["image"])\
    .setOutputCol("answers")\
    .setUseCaching(False)

# OCR pipeline
pipeline = PipelineModel(stages=[
    binary_to_image,
    chart_to_text
])

image_path = pkg_resources.resource_filename('sparkocr', 'resources/ocr/images/figure.jpg')
image_example_df = spark.read.format("binaryFile").load(image_path)

result = pipeline.transform(image_example_df).cache()
val binary_to_image = BinaryToImage()
    .setOutputCol("image")
    .setImageType(ImageType.TYPE_3BYTE_BGR)

val chart_to_text = ChartToTextTable()
    .pretrained("chart_to_text_deplot_jsl", "en", "clinical/ocr")
    .setInputCol(Array("image"))
    .setOutputCol("answers")
    .setUseCaching(False)

val pipeline = new PipelineModel().setStages(Array(
    binary_to_image,
    chart_to_text))

val image_path = pkg_resources.resource_filename("sparkocr", "resources/ocr/images/figure.jpg")
val image_example_df = spark.read.format("binaryFile").load(image_path)

val result = pipeline.transform(image_example_df).cache()
Example
Input:
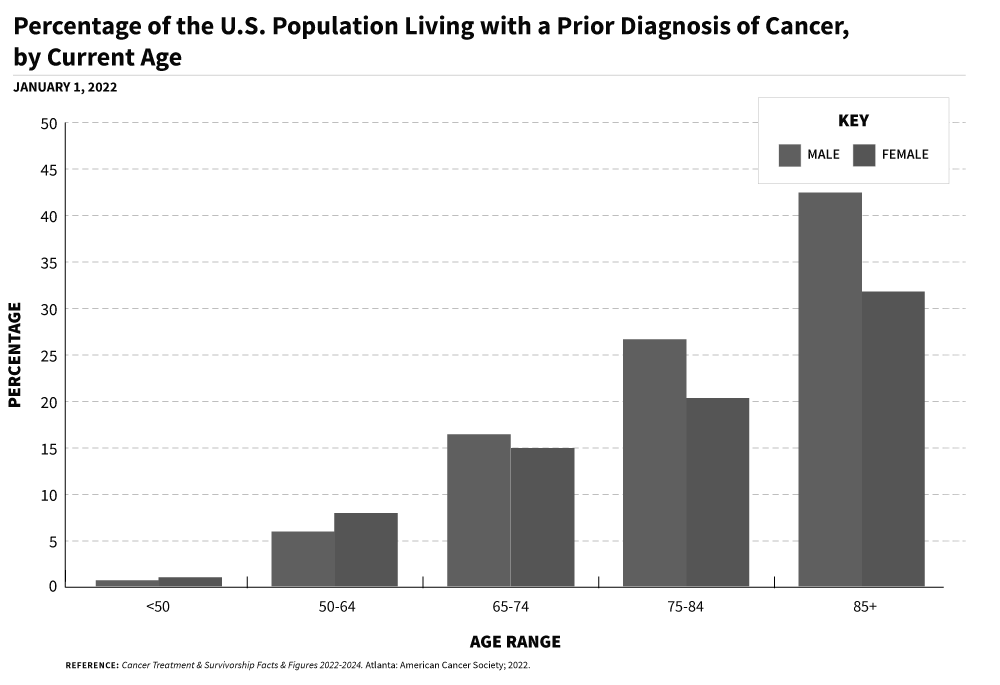
Output:
|[ TITLE | <0x0A> AGE RANGE | MAL | FEMALE <0x0A> <50 | 0.70 | 1.10 <0x0A> 50-64 | 6.10 | 8 <0x0A> 65-74 | 16.40 | 15.10 <0x0A> 75-84 | 26.50 | 20.10 <0x0A> 85+ | 42.50 | 31.60] |
Model Information
| Model Name: | chart_to_text_deplot_jsl |
| Type: | ocr |
| Compatibility: | Visual NLP 5.2.0+ |
| License: | Licensed |
| Edition: | Official |
| Language: | en |